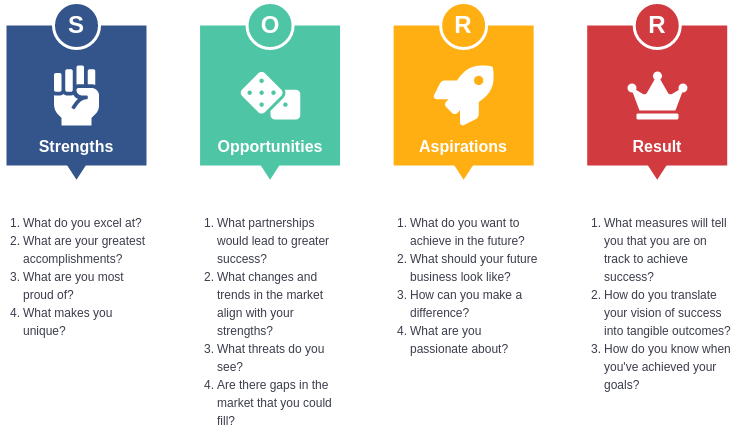
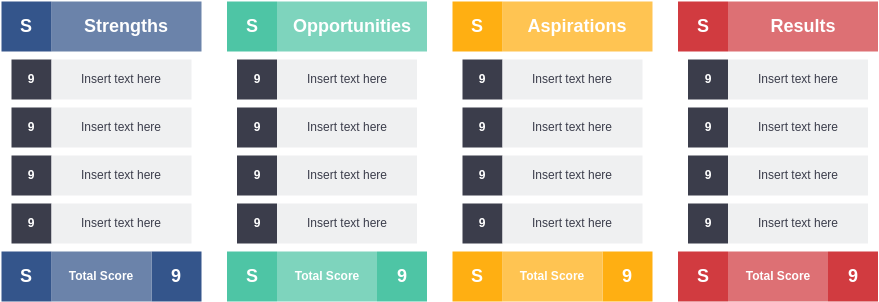
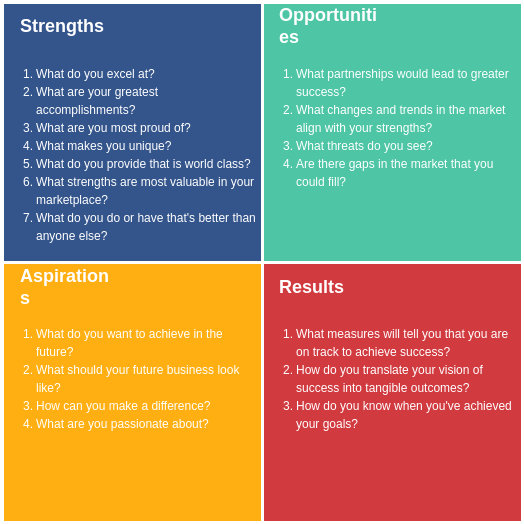
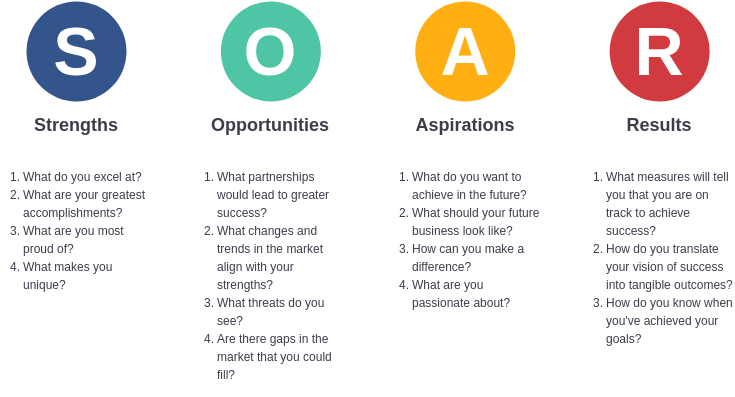
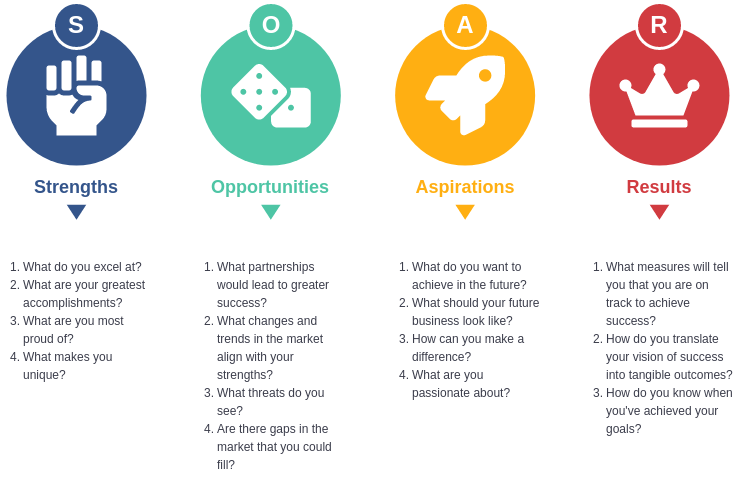
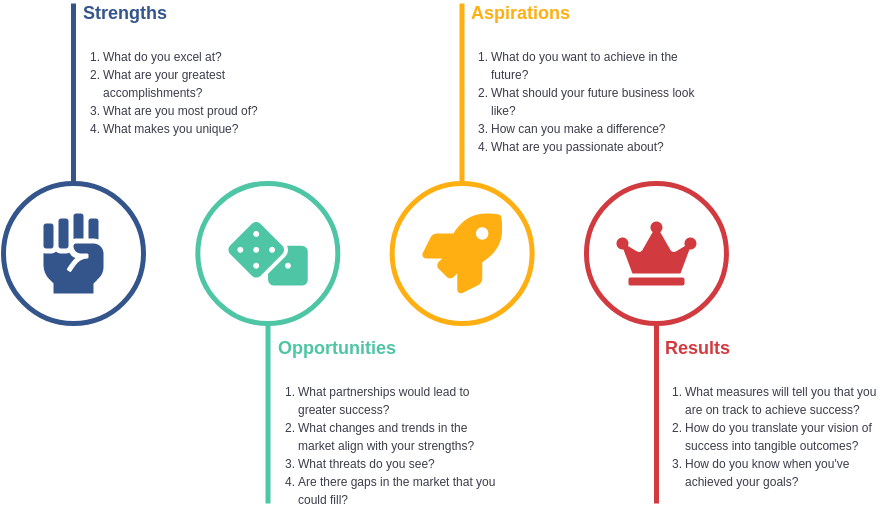
SOAR analysis is a strategic planning tool that emphasizes a positive, future-oriented approach, focusing on Strengths, Opportunities, Aspirations, and Results. Unlike traditional frameworks that often dwell on weaknesses and threats, SOAR encourages organizations to build on their existing strengths and capitalize on opportunities. Here, we’ll explore the components of SOAR analysis through realistic examples to illustrate its practical application.
Components of SOAR Analysis
1. Strengths
Definition: Identifying what the organization does well, including unique resources and capabilities.
Example: Tech Solutions Inc.
- Strengths Identified:
- A highly skilled development team with expertise in AI and machine learning.
- Strong brand reputation for delivering innovative software solutions.
- A loyal customer base that provides consistent feedback for product improvement.
2. Opportunities
Definition: Exploring external factors that the organization can leverage for growth.
Example: Tech Solutions Inc.
- Opportunities Identified:
- Increasing demand for AI-driven solutions in various industries, including healthcare and finance.
- Potential partnerships with academic institutions for research and development.
- Government initiatives promoting digital transformation in small businesses.
3. Aspirations
Definition: Defining the organization’s vision for the future and what it hopes to achieve.
Example: Tech Solutions Inc.
- Aspirations Defined:
- To become a leading provider of AI solutions in North America within five years.
- To launch a new product line focused on AI applications for small businesses.
- To achieve recognition as an industry thought leader by participating in conferences and publishing white papers.
4. Results
Definition: Establishing measurable outcomes that will indicate progress toward achieving aspirations.
Example: Tech Solutions Inc.
- Results Established:
- Increase sales revenue from AI products by 30% annually over the next three years.
- Launch at least two new AI-driven products within the next 18 months.
- Achieve a customer satisfaction score of 90% or higher based on feedback surveys.
Here’s a summary table of Tech Solutions Inc.’s SOAR analysis:
| Component | Description |
|---|---|
| Strengths | – Highly skilled development team in AI and machine learning |
| – Strong brand reputation for innovative software solutions | |
| – Loyal customer base providing consistent feedback | |
| Opportunities | – Increasing demand for AI-driven solutions in various industries |
| – Potential partnerships with academic institutions for R&D | |
| – Government initiatives promoting digital transformation in small businesses | |
| Aspirations | – Become a leading provider of AI solutions in North America within five years |
| – Launch a new product line focused on AI applications for small businesses | |
| – Achieve recognition as an industry thought leader through conferences and publications | |
| Results | – Increase sales revenue from AI products by 30% annually over the next three years |
| – Launch at least two new AI-driven products within the next 18 months | |
| – Achieve a customer satisfaction score of 90% or higher based on feedback surveys |
This table succinctly summarizes the SOAR analysis for Tech Solutions Inc., highlighting their strengths, opportunities, aspirations, and measurable results.
Putting It All Together: A Practical Application
Case Study: Green Earth Gardening Co.
Background: Green Earth Gardening is a small business specializing in eco-friendly gardening products and services. The owners recognized the need for a strategic plan to expand their market presence.
Conducting SOAR Analysis
Step 1: Strengths
- Identified Strengths:
- Unique product offerings, such as organic fertilizers and biodegradable gardening tools.
- Strong community engagement through workshops and local events.
- Knowledgeable staff passionate about sustainable gardening practices.
Step 2: Opportunities
- Identified Opportunities:
- Growing consumer interest in sustainable and eco-friendly products.
- Expansion into online sales, reaching a wider audience.
- Collaborations with local schools for educational gardening programs.
Step 3: Aspirations
- Defined Aspirations:
- To become the go-to resource for eco-friendly gardening solutions in the region within three years.
- To establish an online store to increase sales and accessibility.
- To educate the community about sustainable gardening practices through monthly workshops.
Step 4: Results
- Established Results:
- Achieve a 25% increase in sales over the next year.
- Launch the online store within six months.
- Conduct at least 12 community workshops each year, with a target attendance of 50 participants per workshop.
Here’s a summary table of the SOAR analysis for Green Earth Gardening Co.:
| SOAR Components | Description |
|---|---|
| Strengths | – Unique product offerings (organic fertilizers, biodegradable tools) |
| – Strong community engagement through workshops and local events | |
| – Knowledgeable staff passionate about sustainable gardening practices | |
| Opportunities | – Growing consumer interest in sustainable and eco-friendly products |
| – Expansion into online sales to reach a wider audience | |
| – Collaborations with local schools for educational gardening programs | |
| Aspirations | – Become the go-to resource for eco-friendly gardening solutions in the region within three years |
| – Establish an online store to increase sales and accessibility | |
| – Educate the community about sustainable gardening through monthly workshops | |
| Results | – Achieve a 25% increase in sales over the next year |
| – Launch the online store within six months | |
| – Conduct at least 12 community workshops each year with a target attendance of 50 participants |
This table provides a clear overview of the SOAR analysis for Green Earth Gardening Co., highlighting their strengths, opportunities, aspirations, and measurable results.
Benefits of Using SOAR Analysis
- Positive Focus: By concentrating on strengths and opportunities, organizations can foster a culture of positivity and collaboration.
- Clear Vision: Defining aspirations provides a clear direction and motivates teams to work toward common goals.
- Measurable Outcomes: Establishing results ensures accountability and helps track progress, allowing organizations to adjust strategies as needed.
Visualizing analysis in the form of infographics
Visualizing analysis in the form of infographics offers several compelling advantages:
1. Enhanced Understanding
- Simplification of Complex Information: Infographics distill complex data and concepts into easily digestible visuals, making it easier for audiences to grasp key points quickly.
- Clarity: Visual representations help clarify relationships and hierarchies, reducing the likelihood of misinterpretation.
2. Improved Retention
- Memory Aid: People are more likely to remember visual information than text alone. Infographics leverage colors, images, and layouts to enhance recall.
- Engagement: Engaging visuals capture attention and encourage viewers to explore the content further, increasing retention rates.
3. Effective Communication
- Immediate Insight: Infographics convey essential information at a glance, allowing for quick assessments and decision-making.
- Storytelling: They can tell a story or illustrate a narrative, helping to contextualize data and analyses in a way that resonates with the audience.
4. Aesthetic Appeal
- Visual Appeal: Well-designed infographics are more attractive than plain text, making content more inviting and enjoyable to engage with.
- Branding Opportunities: Infographics can be tailored to reflect an organization’s brand, enhancing brand recognition and consistency.
5. Versatile Use
- Multi-Platform Sharing: Infographics are easily shareable across various platforms, including social media, presentations, and reports, broadening reach and impact.
- Cross-Disciplinary Applications: They can be used in various fields, such as marketing, education, business, and healthcare, making them a versatile communication tool.
6. Data Visualization
- Highlighting Trends and Patterns: Infographics can effectively illustrate trends, comparisons, and distributions, providing insights that might be missed in traditional reports.
- Interactive Elements: Some infographics incorporate interactive elements, allowing users to engage with the data for a more personalized experience.
Why Visual Paradigm Online is the Ideal Platform for Diagramming and Infographics
In today’s fast-paced digital world, effective communication is essential, and visual tools play a crucial role in conveying complex ideas simply and clearly. Visual Paradigm Online stands out as an ideal platform for creating diagrams, infographics, and charts. Here’s why it’s a top choice for individuals and teams alike.
1. User-Friendly Interface
Visual Paradigm Online boasts an intuitive interface that caters to users of all skill levels. Whether you are a seasoned designer or a complete beginner, you can easily navigate the platform, making it simple to create professional-looking visuals without extensive training.
2. Wide Range of Diagram Types
The platform offers a diverse array of diagram types, including:
- Flowcharts: Perfect for illustrating processes and workflows.
- Mind Maps: Great for brainstorming and organizing thoughts.
- Org Charts: Useful for visualizing organizational structures.
- UML Diagrams: Essential for software development and system modeling.
- Infographics: Ideal for presenting data in a visually appealing manner.
This versatility makes Visual Paradigm Online suitable for various fields, from business and education to software development.
3. Customizable Templates
Visual Paradigm Online provides a rich library of customizable templates. Users can choose from pre-designed layouts tailored to specific needs, allowing for quick and easy creation of diagrams and infographics. This feature saves time and ensures that your visuals are both attractive and effective.
4. Collaboration Features
In an increasingly remote work environment, collaboration is key. Visual Paradigm Online allows multiple users to work on the same project simultaneously. Real-time collaboration features enable teams to share ideas, provide feedback, and make adjustments on the fly, enhancing teamwork and productivity.
5. Cloud-Based Accessibility
Being cloud-based means you can access your projects from anywhere, at any time. Whether you’re in the office, at home, or on the go, Visual Paradigm Online ensures that your work is always available. This flexibility is particularly beneficial for teams spread across different locations.
6. Integration with Other Tools
Visual Paradigm Online integrates seamlessly with various productivity tools and platforms, such as Google Drive, Microsoft Teams, and Slack. This makes it easy to incorporate your diagrams and infographics into existing workflows and share them across different channels.
7. Strong Support and Resources
The platform offers extensive support through tutorials, webinars, and a rich knowledge base. Whether you need help with a specific feature or want to learn best practices for diagramming, Visual Paradigm Online provides ample resources to enhance your experience.
Conclusion
SOAR analysis is an effective tool for organizations looking to align their strengths with market opportunities while setting clear aspirations and measurable results. By focusing on what they do well and envisioning their future, organizations can create strategic plans that not only enhance performance but also foster a positive organizational culture. The examples of Tech Solutions Inc. and Green Earth Gardening Co. illustrate how SOAR can be applied in diverse contexts, driving growth and success in a competitive landscape.
Visual Paradigm Online is an exceptional platform for anyone looking to create diagrams, infographics, and charts. Its user-friendly interface, wide range of diagram types, customizable templates, collaboration features, and cloud-based accessibility make it ideal for individuals and teams across various industries. Whether you’re a student, a business professional, or a software developer, Visual Paradigm Online equips you with the tools you need to visualize your ideas effectively and efficiently. Embrace the power of visual communication with Visual Paradigm Online today!
