What is a Cluster Diagram?
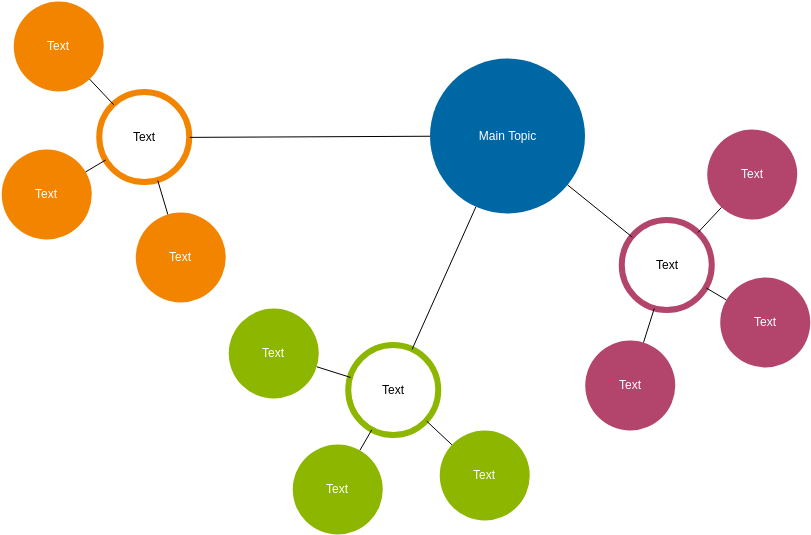
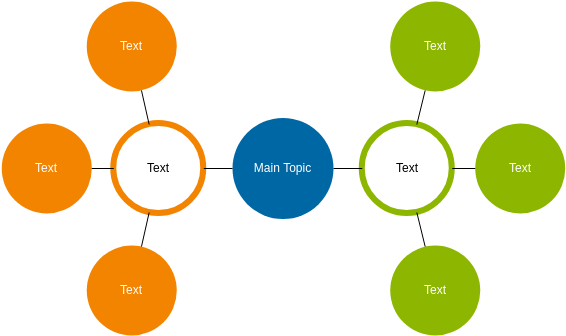
A cluster diagram, also known as a clustering diagram, is a visual representation that illustrates a group of related items or concepts that are closely connected. This type of diagram serves as an effective tool for organizing and categorizing information, making it easier to understand relationships and hierarchies among various elements.
The Concept of Clustering
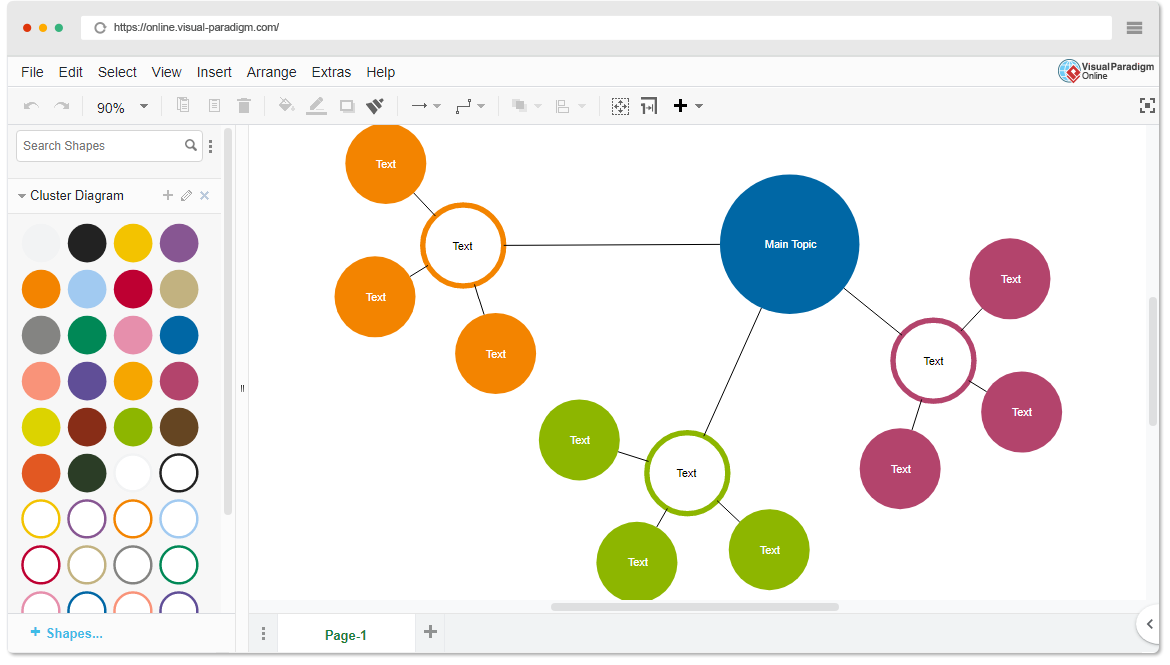
At its core, clustering refers to the grouping of discrete items that share common characteristics or themes. In a cluster diagram, these items are visually represented as nodes or elements within a larger framework, highlighting their proximity and interconnections. This diagrammatic approach helps to simplify complex information, making it more digestible and accessible.
How Cluster Diagrams Compare to Other Diagrams
Cluster diagrams can be compared to other types of diagrams, each serving unique purposes but sharing fundamental similarities in their structure:
- Network Diagrams: Like network diagrams, cluster diagrams depict relationships but focus on a group of related items rather than a broader network. A network diagram organizes connections in a systematic way, while a cluster diagram presents a more flexible arrangement of items.
- Flow Diagrams: Flow diagrams illustrate processes or movements, showing how items interact in a sequential manner. In contrast, cluster diagrams emphasize the relationships among items without implying a specific sequence or flow.
- Tree Diagrams: Tree diagrams represent hierarchical structures, displaying relationships in a branching format. A cluster diagram, while not inherently hierarchical, can incorporate elements of a tree diagram by showing clusters that may have sub-clusters or categories.
The Interconnectedness of Diagrams
Despite their differences, all these diagrams can be viewed as interconnected forms of visual representation. For instance, a network diagram can be seen as a more orderly arrangement of a cluster diagram, while a flow diagram can represent the linear pathways within a cluster. Similarly, tree diagrams can illustrate how certain clusters may branch out into more specialized sub-clusters.
Applications of Cluster Diagrams
Cluster diagrams find applications across various fields, including:
- Brainstorming: Facilitating idea generation by visually grouping related thoughts or concepts.
- Project Management: Organizing tasks and responsibilities within a project by clustering related elements.
- Research: Summarizing findings and categorizing information to identify key themes or patterns.
- Education: Aiding students in understanding complex topics by breaking them down into manageable clusters.
Conclusion
Cluster diagrams are versatile visual tools that effectively represent groups of related items or concepts. By understanding their structure and purpose, users can leverage cluster diagrams to organize information, enhance communication, and facilitate collaboration. Whether in brainstorming sessions, project management, or research, cluster diagrams provide a clear, visual method for navigating complex data and uncovering meaningful connections.
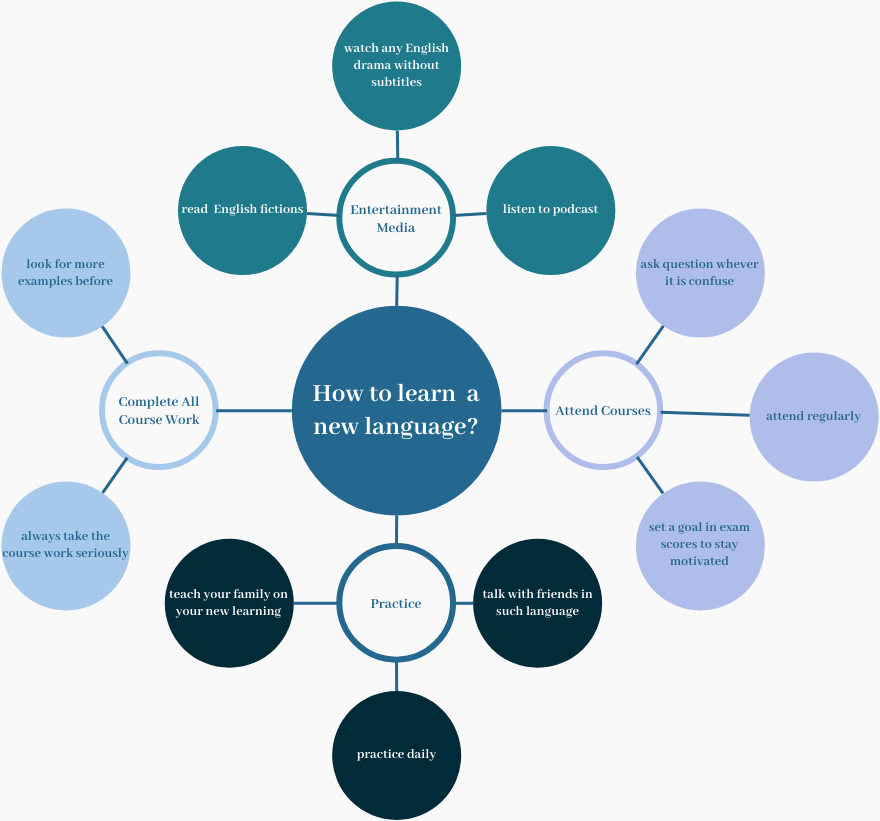
In the case study above, the cluster diagram effectively organizes various strategies for learning a new language, illustrating how different methods interconnect and support the central goal. By breaking down the process into manageable clusters, learners can identify specific actions to take, ensuring a comprehensive approach to language acquisition. This visual representation not only aids in planning but also serves as a motivational tool, encouraging learners to engage with multiple facets of language learning.
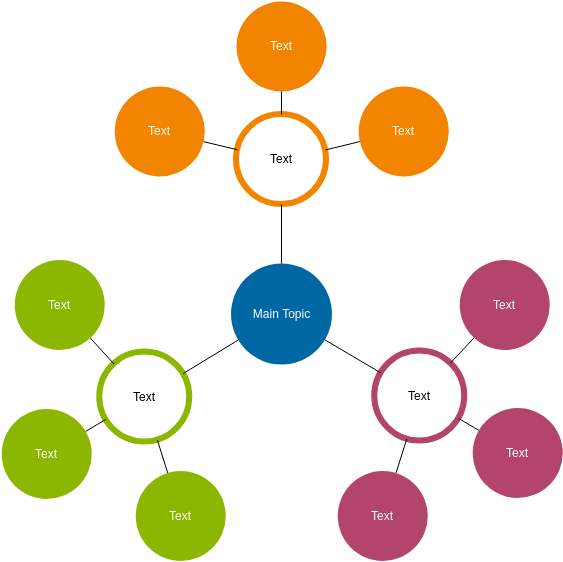
Cluster Diagram Template – Visual Paradigm Online
Cluster Diagram Template: Learn a Language
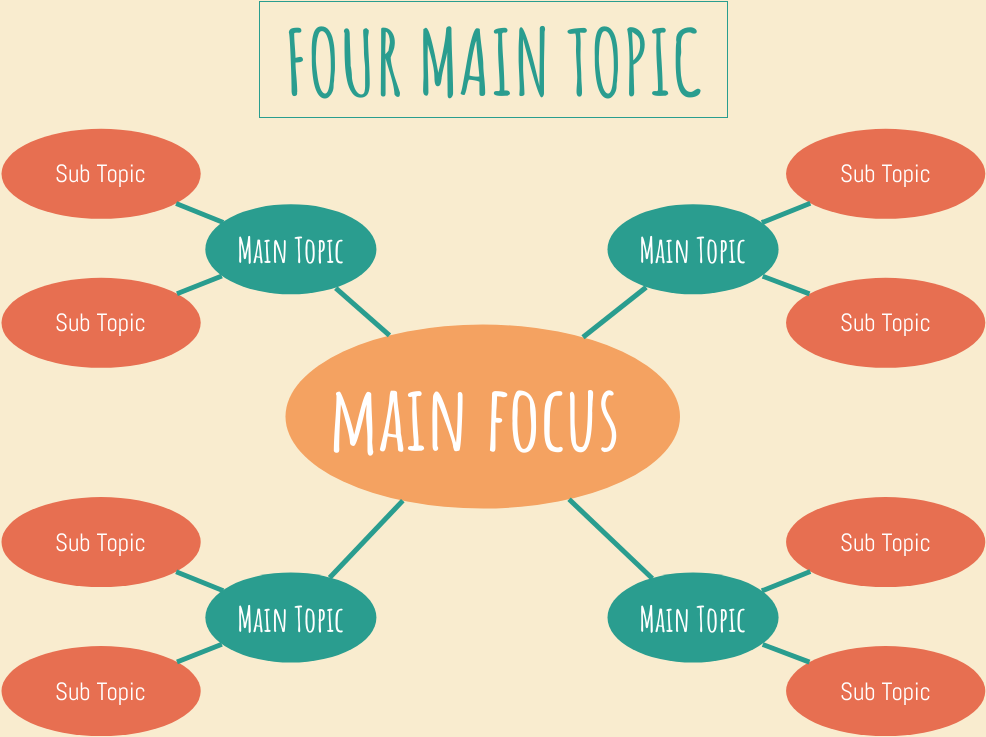
Cluster Diagram Template: Four Main Topics
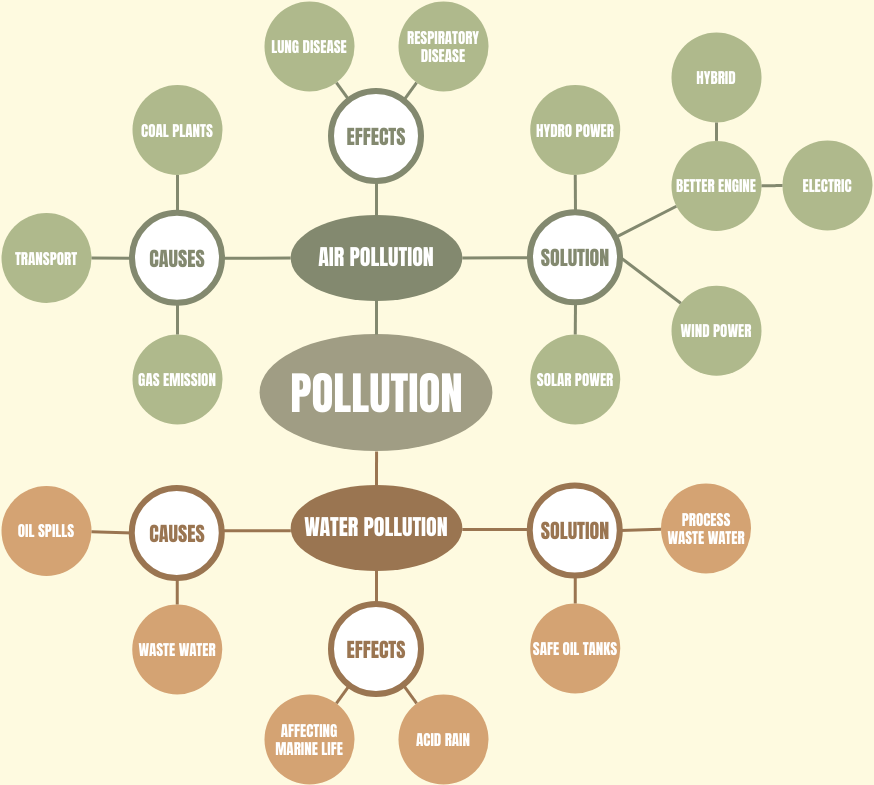
Cluster Diagram Example: Pollution
