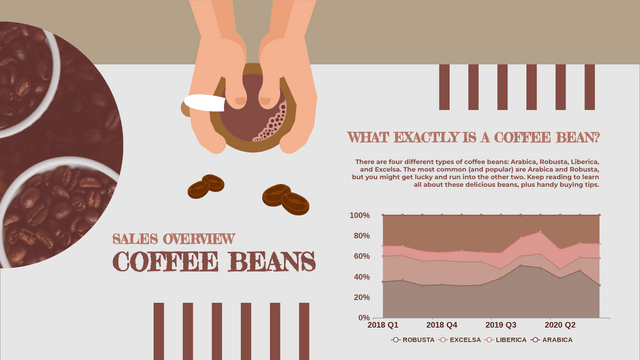
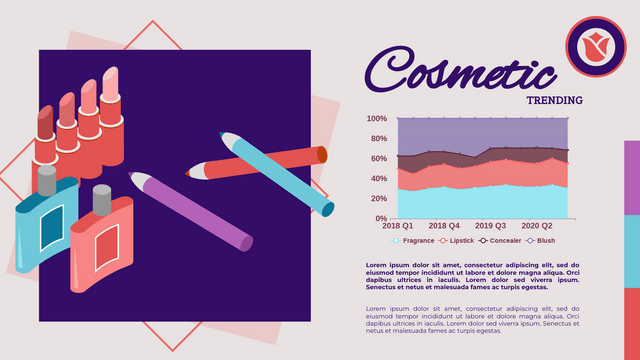
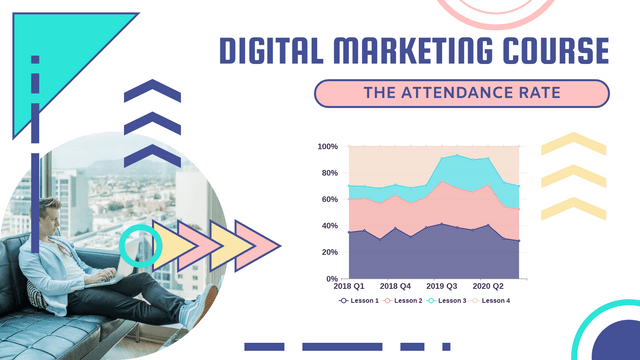
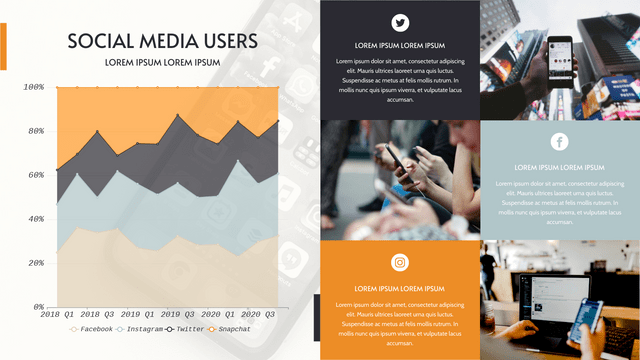
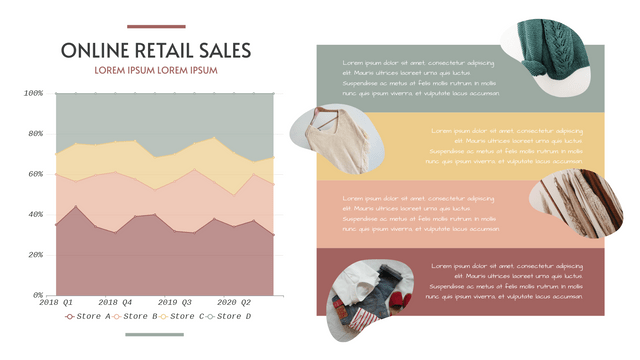
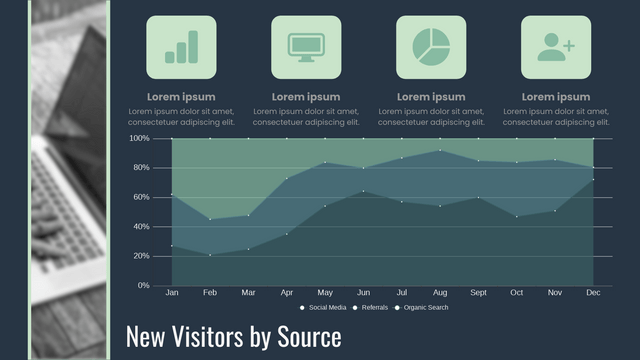
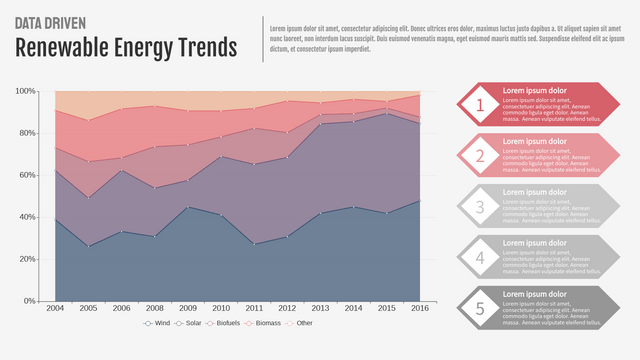
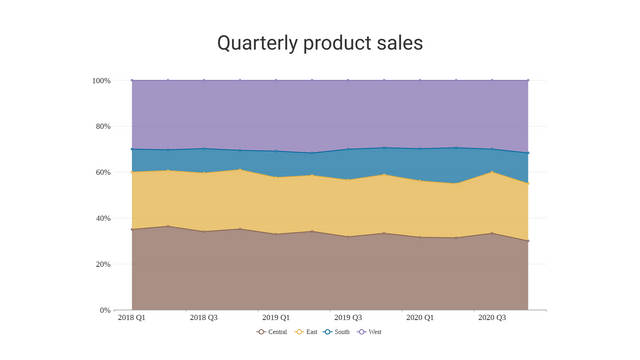
A 100% stacked area chart is a powerful visualization tool that allows you to display the relative contribution of multiple data series over a given time period, showing how each series contributes to the total. This type of chart is particularly useful when you want to emphasize the percentage share of each category while tracking changes over time.

Key Concepts
- Normalization: In a 100% stacked area chart, the total of all series for a given category (e.g., time period) is normalized to 100%. This means that the height of the stacked areas represents the proportion of each category relative to the total.
- Time Series Data: This chart is often used with time series data, where the x-axis represents time intervals (days, months, years) and the y-axis represents the percentage of total values.
- Multiple Series Representation: Each area in the chart corresponds to a different category or data series. The areas are stacked on top of each other, making it easy to compare the contributions of each series to the total.
- Visual Impact: The use of colors and areas can help viewers quickly grasp the trends and shifts in data composition over time.
Example Scenario
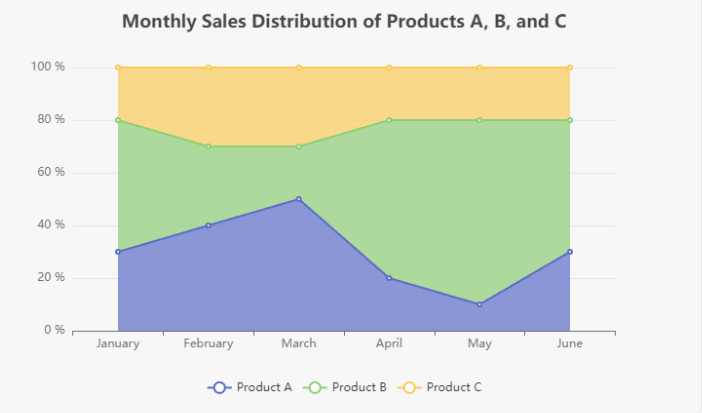
Consider a company that sells three different products: A, B, and C. Over the past year, the company wants to visualize how the sales percentages of these products have changed monthly.
Data
Here’s a simplified dataset:
| Month | Product A | Product B | Product C |
|---|---|---|---|
| January | 30 | 50 | 20 |
| February | 40 | 30 | 30 |
| March | 50 | 20 | 30 |
| April | 20 | 60 | 20 |
| May | 10 | 70 | 20 |
| June | 30 | 50 | 20 |
Visualization with Visual Paradigm Online Chart
Discover Visual Paradigm Online: Your Ultimate Visual Solution
Are you looking for a powerful tool to create stunning charts, diagrams, infographics, and more? Your search ends with Visual Paradigm Online!
Why Choose Visual Paradigm Online?
Comprehensive Charting
Easily create a wide range of charts—from simple bar and line charts to complex stacked and radar charts. Our intuitive interface simplifies data visualization, making it accessible for everyone.
Versatile Diagramming
Whether you need flowcharts, UML diagrams, or organizational charts, Visual Paradigm Online has you covered. Customize your diagrams effortlessly and share them seamlessly with your team.
Stunning Infographics
Transform your data into eye-catching infographics that effectively convey your message. Choose from a diverse selection of templates and design elements to make your visuals stand out.
Collaboration Made Simple
Work with your team in real-time! Share projects, gather feedback, and collaborate on edits to ensure everyone is aligned and engaged.
Cloud-Based Convenience
Access your projects anytime, anywhere. Our cloud-based platform allows you to work from any device without requiring installations or complicated setups.
User-Friendly Interface
No design experience? No problem! Our intuitive tools and templates empower anyone to create professional-quality visuals in just minutes.
Unlock Your Creative Potential
With Visual Paradigm Online, you can bring your ideas to life and communicate effectively through visuals. Whether you’re a student, educator, business professional, or designer, our platform equips you with everything you need to succeed.
Start Your Free Trial Today!
Join thousands of satisfied users and experience the ultimate solution for all your visual needs. Sign up for a free trial today and discover how Visual Paradigm Online can elevate your projects to new heights!
Visual Paradigm Online – Where Ideas Transform into Visual Masterpieces!
Conclusion
A 100% stacked area chart provides a clear and effective way to visualize how different data series contribute to a total over time. By focusing on percentage contributions rather than absolute values, it allows for easy comparison and analysis of trends. Using tools like Visual Paradigm online Chart makes it straightforward to create interactive and responsive visualizations that enhance data understanding.
