What is a Pareto Chart?
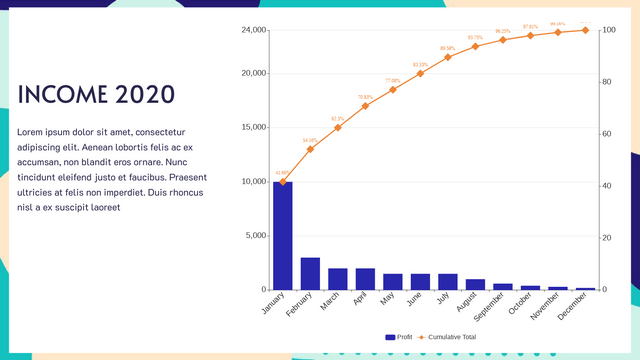
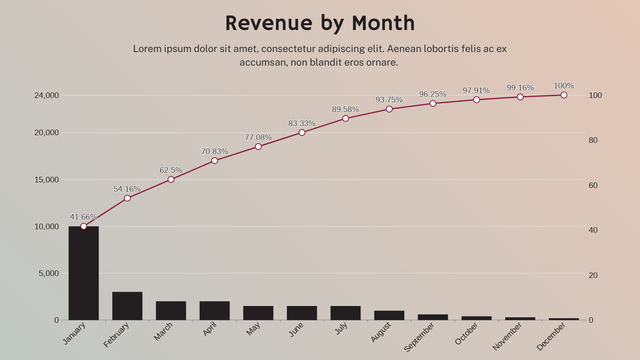
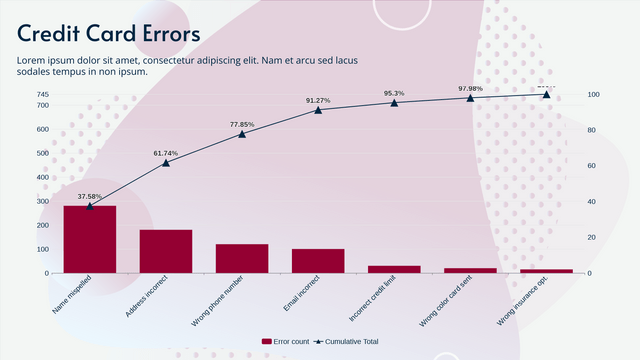
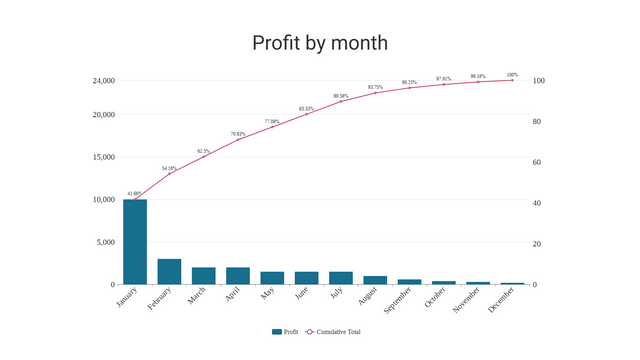
A Pareto Chart is a type of bar graph that represents the frequency or impact of problems or causes in a descending order. It is based on the Pareto Principle, which states that roughly 80% of effects come from 20% of the causes. This chart helps identify the most significant factors in a dataset, allowing for targeted problem-solving and resource allocation.
Key Concepts
- Bars: Represent individual categories or causes, ordered from highest to lowest based on their frequency or impact.
- Cumulative Line: Shows the cumulative percentage of the total as you move along the bars, indicating the proportion of the total that each category contributes.
- Focus on the Vital Few: Highlighting the most significant factors lets teams prioritize their efforts.
Example: Customer Complaints Analysis
Scenario
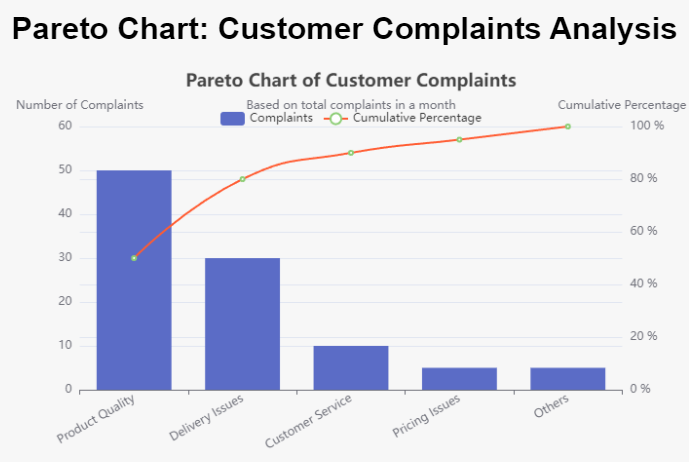
Imagine a customer service department wants to analyze complaints received over a month. The data collected is as follows:
- Product Quality: 50 complaints
- Delivery Issues: 30 complaints
- Customer Service: 10 complaints
- Pricing Issues: 5 complaints
- Others: 5 complaints
Step 1: Organizing the Data
| Complaint Type | Count |
|---|---|
| Product Quality | 50 |
| Delivery Issues | 30 |
| Customer Service | 10 |
| Pricing Issues | 5 |
| Others | 5 |
Step 2: Calculate Cumulative Percentages
| Complaint Type | Count | Cumulative Count | Cumulative Percentage |
|---|---|---|---|
| Product Quality | 50 | 50 | 50% |
| Delivery Issues | 30 | 80 | 80% |
| Customer Service | 10 | 90 | 90% |
| Pricing Issues | 5 | 95 | 95% |
| Others | 5 | 100 | 100% |
Step 3: Creating the Pareto Chart
Conclusion
A Pareto Chart is a powerful tool for identifying key problems and prioritizing solutions. By understanding the data and visualizing it effectively, teams can focus on the areas that will yield the greatest impact. The example above illustrates how to create a Pareto Chart using Visual Paradigm online, providing a clear visual representation of customer complaints.
Pareto Charts Templates
Visual Paradigm Online offers a variety of templates that can significantly aid in learning chart creation for problem-solving and analysis. Here are some recommended templates and their uses:
1. Flowchart Template
- Use: Ideal for mapping out processes or workflows. It helps visualize steps in a problem-solving scenario.
- Learning Benefit: Understand how to break down complex processes into manageable parts.
2. Fishbone Diagram (Ishikawa) Template
- Use: Useful for identifying the root causes of a problem. It categorizes potential causes into different categories.
- Learning Benefit: Develop skills in cause-and-effect analysis, which is crucial for effective problem-solving.
3. Pareto Chart Template
- Use: Focuses on identifying the most significant factors contributing to a problem, based on the 80/20 rule.
- Learning Benefit: Learn to prioritize issues based on impact, enabling targeted solutions.
4. Mind Map Template
- Use: Great for brainstorming and organizing ideas related to a problem.
- Learning Benefit: Enhance creative thinking and visualization of relationships among different concepts.
5. SWOT Analysis Template
- Use: Analyzes Strengths, Weaknesses, Opportunities, and Threats related to a situation or decision.
- Learning Benefit: Foster strategic thinking skills by evaluating internal and external factors.
6. Gantt Chart Template
- Use: Useful for project management, showing tasks over time.
- Learning Benefit: Understand project planning and resource allocation.
7. Bubble Chart Template
- Use: Visualizes relationships between three variables, which can help in prioritizing projects or issues.
- Learning Benefit: Gain insights into multi-dimensional data analysis.
How to Use Visual Paradigm Online Templates
- Select a Template: Choose one that fits your analysis needs.
- Customize: Modify the template to include your specific data and context.
- Analyze: Use the chart to facilitate discussions, identify problems, and propose solutions.
- Iterate: Revise your chart as new data or insights emerge.
Utilizing Visual Paradigm Online templates can elevate your learning experience in chart creation for problem-solving and analysis. Each template serves a unique purpose, helping you develop a comprehensive toolkit for effective analysis. Explore these templates to enhance your analytical skills and improve decision-making processes.
