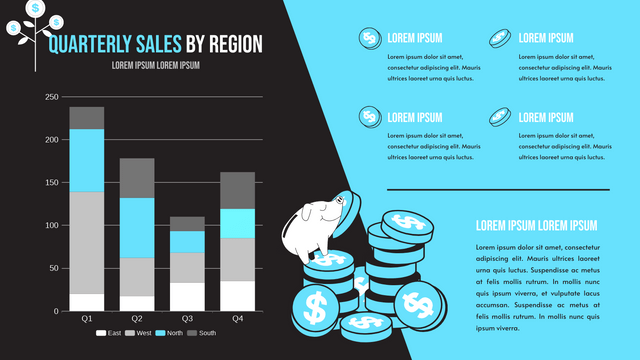
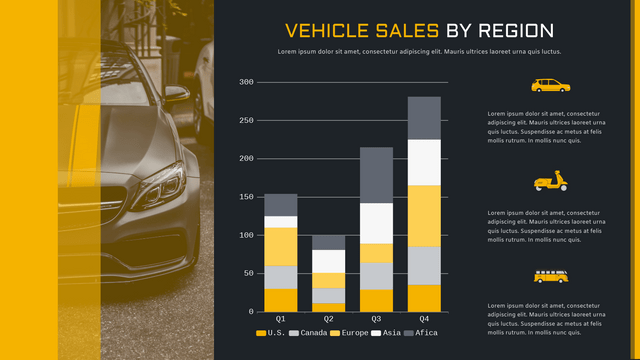
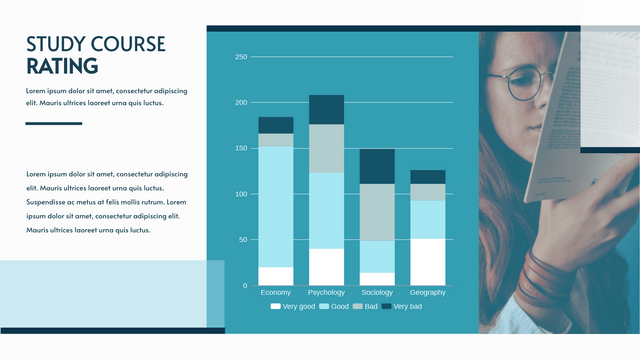
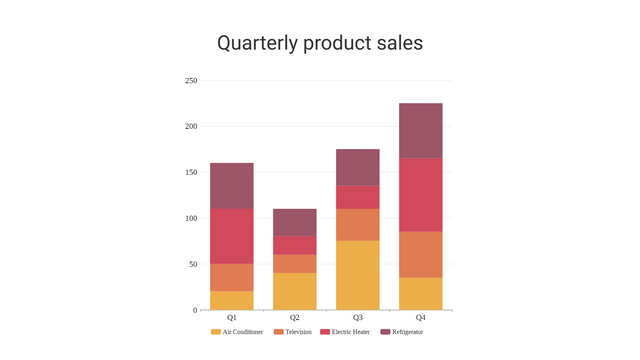
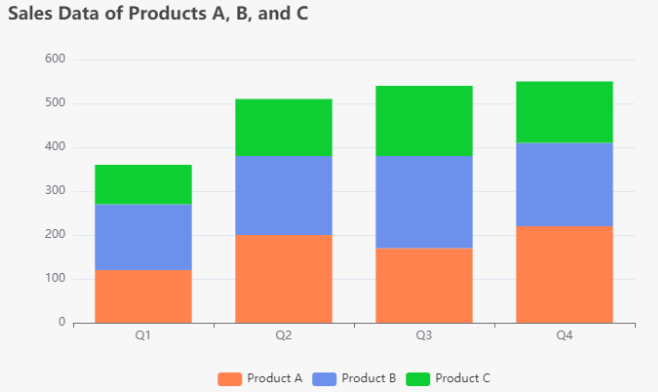
In this tutorial, we will explore how to create a stacked column chart using Visual Paradigm Online Chart, a powerful and flexible charting library. A stacked column chart is useful for visualizing the composition of different categories over time or across various groups.
Key Concepts
- Stacked Column Chart: This chart type stacks the values of different categories on top of each other, allowing you to see both the total and the breakdown of each category.
- ECharts: A popular open-source visualization library that provides a variety of chart types and customization options.
- Data Structure: The data for a stacked column chart typically includes categories (e.g., months, products) and series (e.g., sales numbers for different regions).
Example Scenario
Let’s say we want to visualize the sales data of three products (A, B, and C) over four quarters. The data is structured as follows:
- Categories: Q1, Q2, Q3, Q4
- Series: Sales for Product A, Product B, and Product C
Prepare Your Data
Here’s the sales data we will use:
| Quarter | Product A | Product B | Product C |
|---|---|---|---|
| Q1 | 120 | 150 | 90 |
| Q2 | 200 | 180 | 130 |
| Q3 | 170 | 210 | 160 |
| Q4 | 220 | 190 | 140 |
Creating the Chart using Visual Paradigm Online Chart
Promote Visual Paradigm Online: Your Ultimate Visual Solution
Are you looking for a powerful tool to create stunning charts, diagrams, infographics, and more? Look no further than Visual Paradigm Online!
Why Choose Visual Paradigm Online?
- Comprehensive Charting: Easily create a wide range of charts, from simple bar and line charts to complex stacked and radar charts. Our intuitive interface makes data visualization a breeze.
- Versatile Diagramming: Whether you need flowcharts, UML diagrams, or organizational charts, Visual Paradigm Online has you covered. Customize your diagrams with ease and share them effortlessly.
- Stunning Infographics: Transform your data into eye-catching infographics that tell a story. Choose from a variety of templates and design elements to make your visuals stand out.
- Collaboration Made Easy: Work with your team in real-time. Share projects, gather feedback, and make changes collaboratively, ensuring everyone is on the same page.
- Cloud-Based Convenience: Access your projects anytime, anywhere. With our cloud-based platform, you can work from any device without the hassle of installations.
- User-Friendly Interface: No design experience? No problem! Our user-friendly tools and templates allow anyone to create professional-quality visuals in minutes.
Unlock Your Creative Potential
With Visual Paradigm Online, you can bring your ideas to life and communicate effectively through visuals. Whether you’re a student, educator, business professional, or designer, our platform offers the tools you need to succeed.
Start Your Free Trial Today!
Join thousands of satisfied users and experience the ultimate solution for all your visual needs. Sign up for a free trial today and discover how Visual Paradigm Online can elevate your projects to the next level!
Visual Paradigm Online – Where Ideas Become Visuals!
Stacked Column Charts Templates
