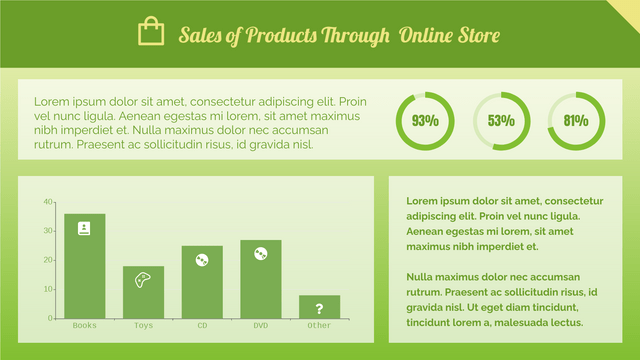
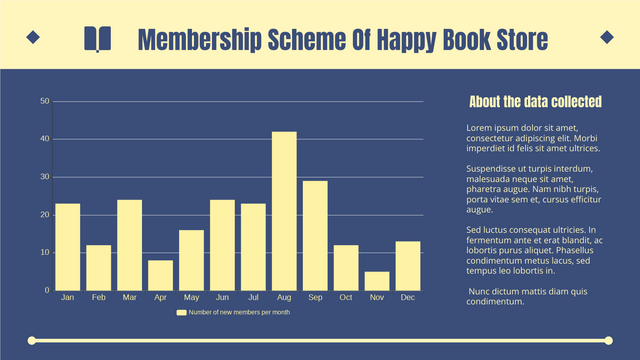
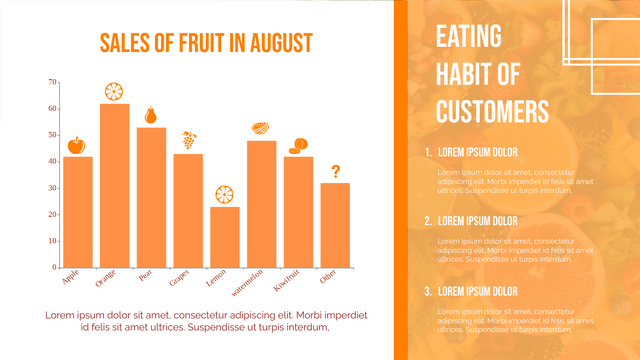
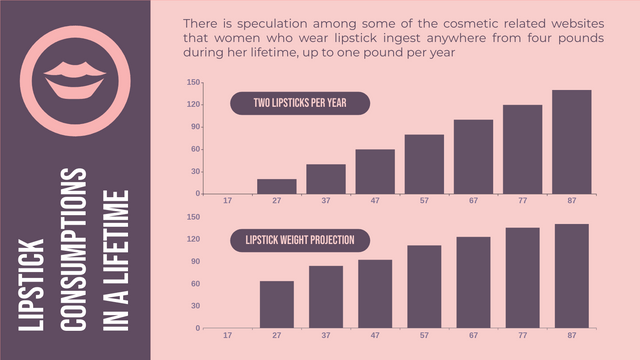
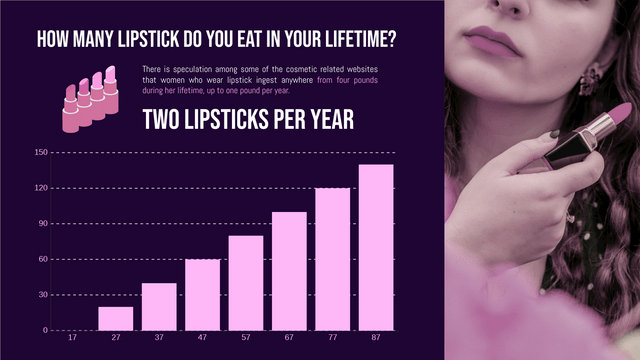
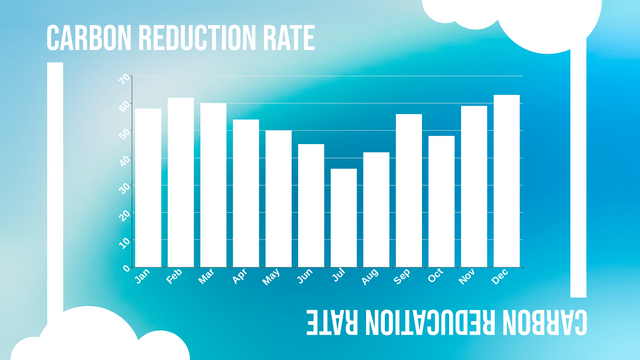
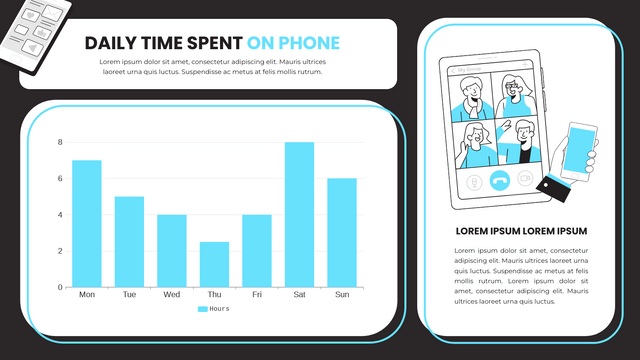
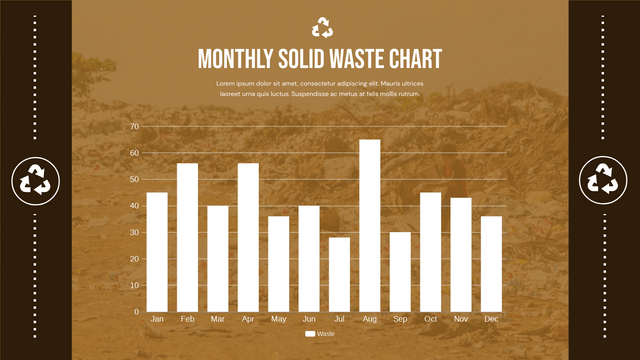
Column charts are a popular way to visualize data, representing values with vertical bars. They are especially useful for comparing different categories or groups. In this tutorial, we’ll explore how to create a column chart using Visual Paradigm Online, highlighting key features and providing an example to demonstrate the process. We’ll also include Visual Paradigm Online Chart to visualize the example.
Key Concepts
1. Flexible Data Management
Visual Paradigm Online allows you to easily manage your data. You can import data from various sources or manually enter it into the chart maker.
2. Add Media
You can enhance your charts by adding media elements such as images or icons, making your presentation more engaging.
3. Drag and Drop
The intuitive drag-and-drop interface enables you to rearrange chart elements effortlessly.
4. Share
Collaboration is easy with the sharing options, allowing you to share your charts with colleagues or clients.
5. Online Access
Being cloud-based, you can access your charts from anywhere, making it convenient for remote work.
6. Fully Customizable
Customize every aspect of your chart, from colors and labels to dividing lines and fonts, ensuring that it fits your specific needs.
Creating a Column Chart: Step-by-Step
Example Scenario
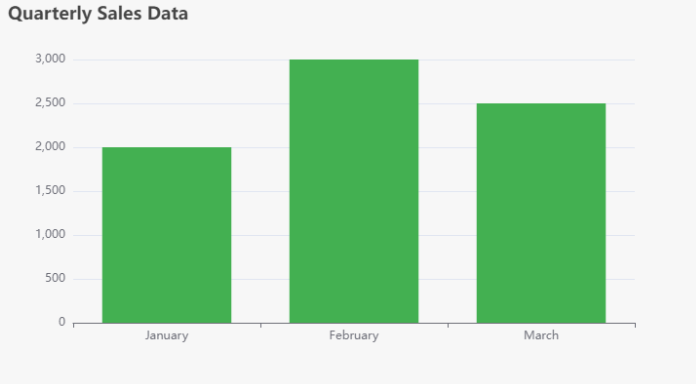
Let’s say we want to visualize the sales data for a company over the first quarter of the year. The data is as follows:
| Month | Sales (in $) |
|---|---|
| January | 2000 |
| February | 3000 |
| March | 2500 |
Step 1: Access Visual Paradigm Online
- Go to Visual Paradigm Online.
- Sign up or log in.
Step 2: Create a New Chart
- From the dashboard, select Create New > Chart.
- Choose Column Chart from the chart options.
Step 3: Input Data
- In the data section, enter your data as shown above.
- Adjust the data type to ensure the sales figures are recognized as numerical values.
Step 4: Customize Chart Elements
- Color: Change the bar colors to represent different months.
- Labels: Add labels for the x-axis (Months) and y-axis (Sales).
- Title: Enter a descriptive title, like “Quarterly Sales Data”.
Step 5: Add Media (Optional)
- If desired, add images or icons to enhance your chart’s visual appeal.
Step 6: Save and Share
- Save your chart and use the share function to collaborate or get feedback.
Column Chart vs. Bar Chart
Column charts and bar charts are both widely used visualization tools for comparing data across categories. While they share similarities, they have distinct characteristics. Here’s a comparison of the two:
1. Orientation
- Column Chart:
- Vertical bars represent data.
- Categories are displayed along the horizontal axis (x-axis).
- Ideal for showing trends over time or comparing a few categories.
- Bar Chart:
- Can be either vertical or horizontal:
- Vertical Bar Chart: Similar to column charts, with vertical bars.
- Horizontal Bar Chart: Bars are displayed horizontally, with categories on the vertical axis (y-axis).
- Useful for comparing longer category names or when there are many categories.
- Can be either vertical or horizontal:
2. Use Cases
- Column Chart:
- Best for illustrating changes over time (e.g., monthly sales).
- Effective for comparisons among a limited number of categories.
- Bar Chart:
- Suitable for comparing different items, especially when category names are long or numerous.
- Great for displaying categorical comparisons (e.g., population by country).
3. Visual Appeal
- Column Chart:
- Often perceived as visually appealing for time series data.
- Easier to read when emphasizing trends.
- Bar Chart:
- Can provide a clearer view for categorical comparisons.
- Less visual clutter when dealing with long category labels.
4. Data Representation
- Column Chart:
- Typically used for discrete data.
- The height of the columns indicates the value.
- Bar Chart:
- Can represent both discrete and continuous data.
- The length of the bars indicates the value.
5. Customization and Flexibility
Both chart types offer customization options, including colors, labels, and additional elements like grid lines. The choice between them often depends on the data presented and the intended audience.
Summary: Bar vs Column Chart
| Feature | Column Chart | Bar Chart |
|---|---|---|
| Orientation | Vertical | Vertical or Horizontal |
| Best Use | Trends over time | Categorical comparisons |
| Visual Appeal | Effective for trends | Clear for many categories |
| Data Representation | Discrete data | Discrete/Continuous data |
In summary, both column and bar charts are effective for comparing data, but the choice between them depends on the nature of your data and how you want to present it. Understanding these differences can help you select the most suitable chart type for your analysis.
Conclusion
Creating a column chart using Visual Paradigm Online is straightforward and highly customizable. With the ability to manage your data flexibly, add media, and share easily, you can create effective visualizations that convey your insights clearly. The provided Visual Paradigm Online chart gives you a way to visualize your data programmatically, offering another layer of flexibility for your presentations.
both column charts and bar charts are valuable tools for visualizing data, each with its own strengths and ideal use cases. Column charts, with their vertical orientation, excel in showcasing trends over time and making comparisons among a limited number of categories. On the other hand, bar charts, which can be displayed either vertically or horizontally, are particularly effective for presenting longer category names and handling numerous categories, facilitating clear comparisons.
When deciding between the two, consider the nature of your data, the amount of information to convey, and the audience’s needs. By understanding the distinctions and capabilities of each chart type, you can choose the most effective visualization method to communicate your insights clearly and effectively. Ultimately, the right choice will enhance your data presentation, making it more engaging and informative for your audience.

