What is a Column and Line Chart?
A Column and Line Chart is a hybrid chart type that combines vertical bars (columns) and a line to represent different datasets on the same graph. This type of chart is particularly useful for comparing two sets of data that share a common x-axis (categories) while highlighting trends over time.
Key Features:
- Columns: Represent discrete data points, such as sales figures for different months.
- Line: Shows trends or relationships over the same categories, such as profit margins or growth rates.
Why Use a Column and Line Chart?
Advantages:
- Comparative Analysis: Allows users to compare different datasets (e.g., sales vs. profit) simultaneously.
- Clarity: Makes it easier to identify trends and patterns, as both datasets are visually represented.
- Space Efficiency: Combines two charts into one, saving space and improving readability.
When to Use a Column and Line Chart?
Use a column and line chart when:
- You want to compare two different measures with a shared categorical axis.
- The data includes both discrete values (e.g., monthly sales) and continuous trends (e.g., profit margins).
- You aim to visualize how one dataset influences or correlates with another over a specific period.
How to Create a Column and Line Chart in Visual Paradigm Online
Step-by-Step Guide
- Sign Up / Log In:
- Visit the Visual Paradigm Online website.
- Create an account or log in to your existing account.
- Create a New Project:
- Click on the Dashboard.
- Select Create New and choose Diagram.
- Select Chart Type:
- In the diagram options, look for Charts.
- Choose Column and Line Chart from the available chart types.
- Add Data:
- Click on the chart area to open the Data Table.
- Input your data for the columns and lines. For example:
- Categories (e.g., Months): Jan, Feb, Mar, Apr, May, Jun, Jul
- Column Data (e.g., Sales): 120, 200, 150, 80, 70, 110, 130
- Line Data (e.g., Profit): 30, 52, 21, 34, 90, 130, 70
- Customize Your Chart:
- Click on different elements (e.g., axes, legend, title) to customize them.
- Adjust colors, labels, and styles to match your preferences.
- Add Titles and Labels:
- Ensure your chart has a clear title, such as “Sales and Profit Analysis”.
- Label axes appropriately (e.g., “Months” for the x-axis, “Sales” and “Profit” for the y-axes).
- Preview Your Chart:
- Once you’ve entered your data and customized the appearance, click on Preview to see how your chart looks.
- Make adjustments as necessary.
- Export and Share:
- When satisfied, you can export your chart as an image or PDF.
- Share it directly from Visual Paradigm Online using sharing options.
Tips for Effective Charts:
- Keep your data organized and concise.
- Use contrasting colors for columns and lines to enhance visibility.
- Ensure legends are clear and positioned well to avoid clutter.
Column and Line Chart Example
Description
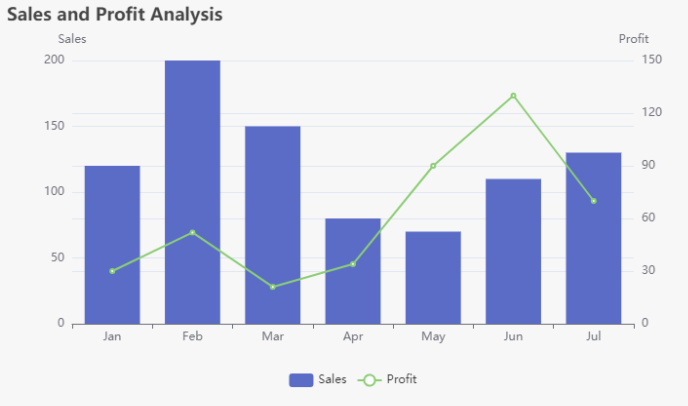
This chart represents the sales and profit data for a fictional company over the first seven months of the year. The data is displayed as follows:
- Sales: Represented by the bar chart, showing the total sales in thousands of dollars for each month.
- Profit: Represented by the line chart, showing the profit in thousands of dollars for the same months.
Dataset
| Month | Sales (in $1000) | Profit (in $1000) |
|---|---|---|
| Jan | 120 | 30 |
| Feb | 200 | 52 |
| Mar | 150 | 21 |
| Apr | 80 | 34 |
| May | 70 | 90 |
| Jun | 110 | 130 |
| Jul | 130 | 70 |
Conclusion
Creating a column and line chart in Visual Paradigm Online is a straightforward process that provides powerful visual insights into your data. By effectively combining discrete and continuous datasets, you can convey complex information in an easily digestible format. Whether for business presentations, reports, or personal projects, mastering this chart type can significantly enhance your data visualization skills.
Whether you’re looking to create a unique chart from scratch or start with a template, Visual Paradigm Online simplifies the process. With its powerful features and extensive library, you can create visually appealing column and line charts that effectively communicate your data insights.
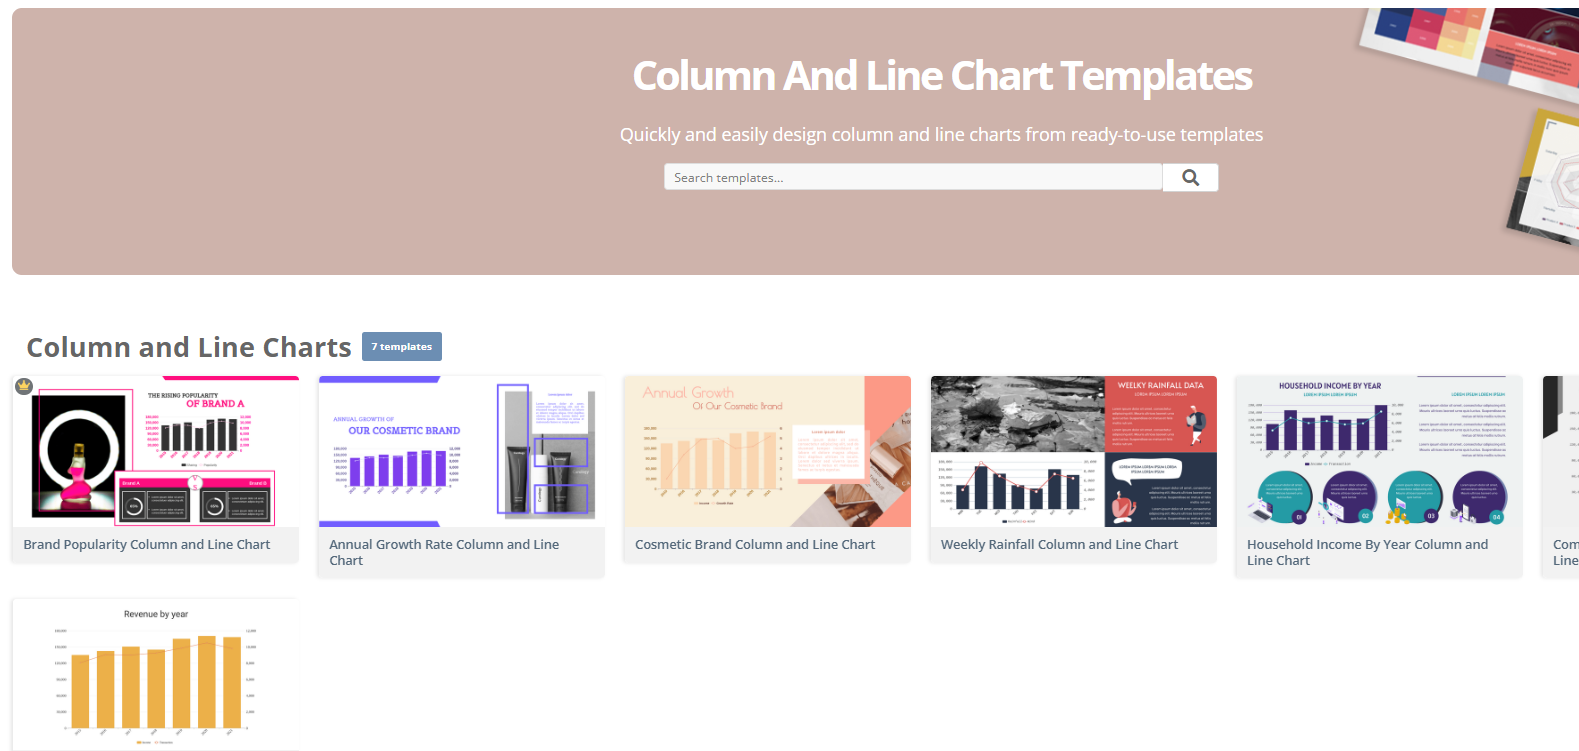
Column and Line Chart Templates
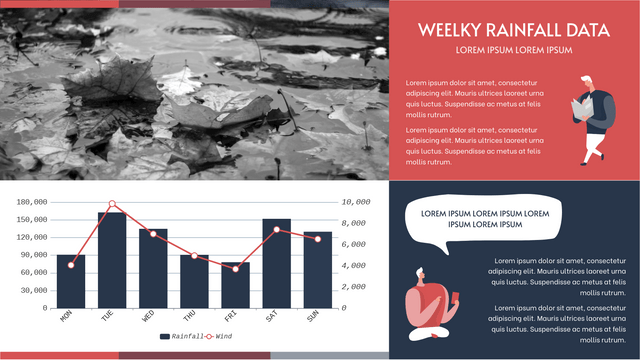
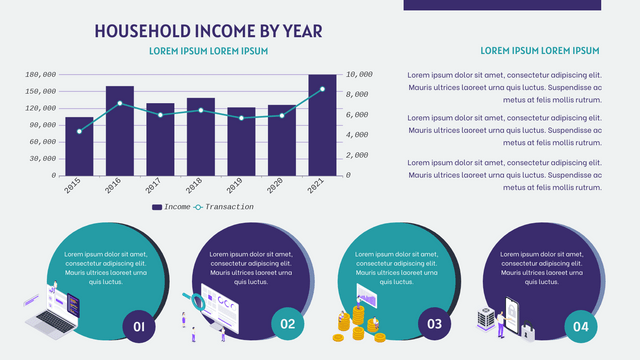
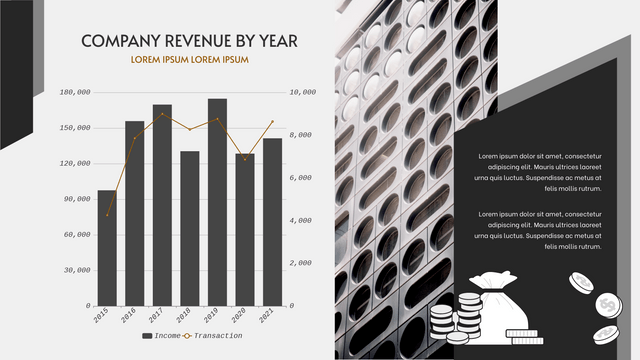
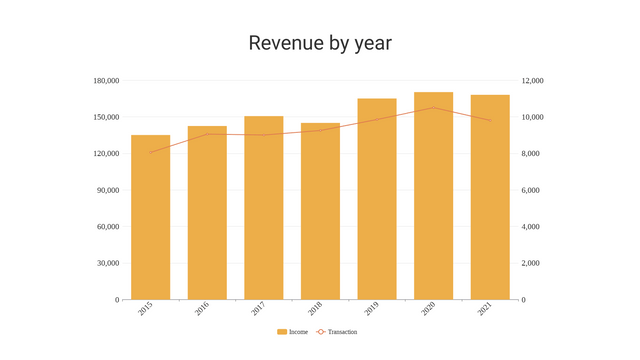
A Column and Line Chart is a versatile combination chart that merges both column and line elements to effectively visualize data. This chart type is particularly useful for presenting datasets that encompass both categorical and continuous variables. The columns represent distinct data categories, while the lines depict trends or changes over time. This dual representation makes the column and line chart an appealing and informative choice for various fields, including business, finance, marketing, and more.
Easy Creation with Visual Paradigm Online
Creating a column and line chart is straightforward with Visual Paradigm Online’s chart maker. You can effortlessly input your data and customize various chart elements such as data labels, axis titles, colors, and more. The intuitive interface empowers you to design a chart tailored to your specific data visualization needs.
Explore Rich Template Library
In addition to crafting custom charts, Visual Paradigm Online offers a comprehensive template library filled with pre-designed column and line chart templates. You can browse through this library for inspiration or choose a template that aligns with your objectives. Each template can be further customized by editing the data, adjusting chart elements, and refining the overall design. This not only saves time but also ensures a polished and professional appearance for your charts.
Column and Line Charts Templates


