Introduction
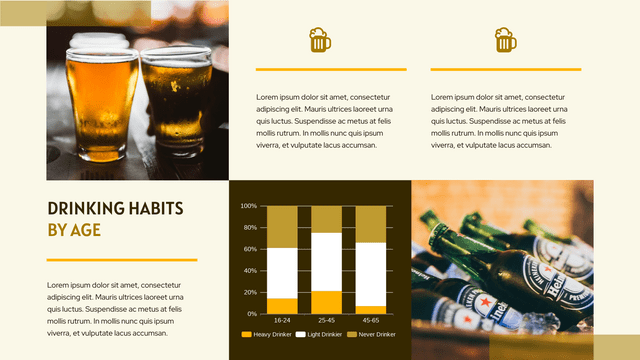
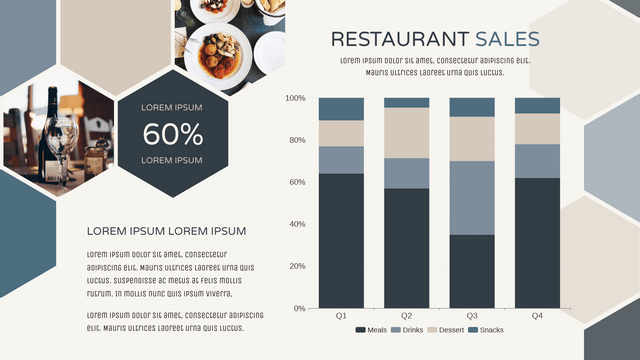
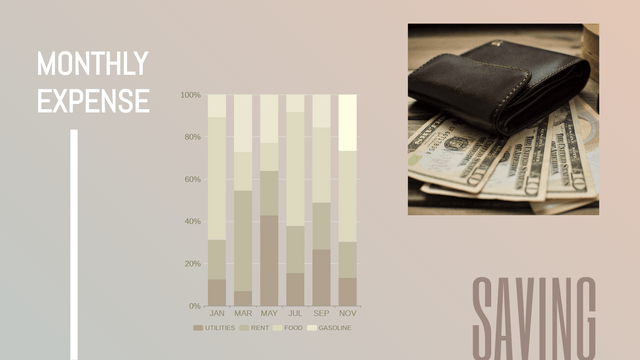
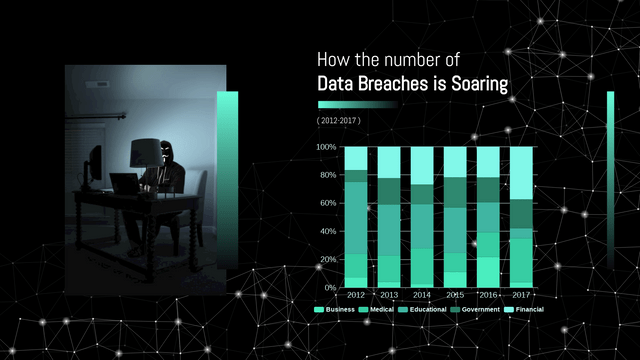
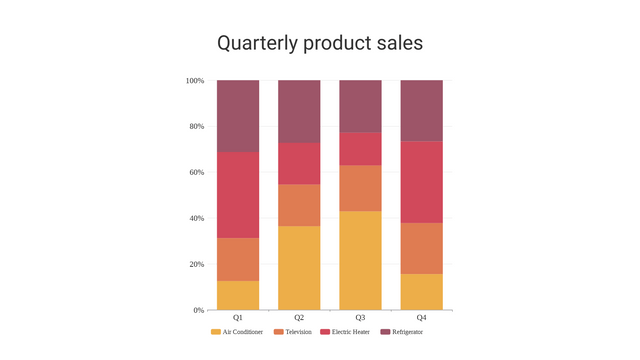
A 100% stacked column chart is a great way to visualize the composition of different categories as a percentage of a whole. Unlike a standard stacked column chart, where the actual values are displayed, a 100% stacked column chart shows the relative proportion of each category within a total, making it easier to compare percentages across different groups.
Key Concepts
- Data Preparation: Ensure your data is structured to represent categories and their respective values.
- Normalization: Convert absolute values into percentages to reflect the relative contribution of each category.
- ECharts Configuration: Set up the chart options to display a 100% stacked column chart correctly.
Example Scenario
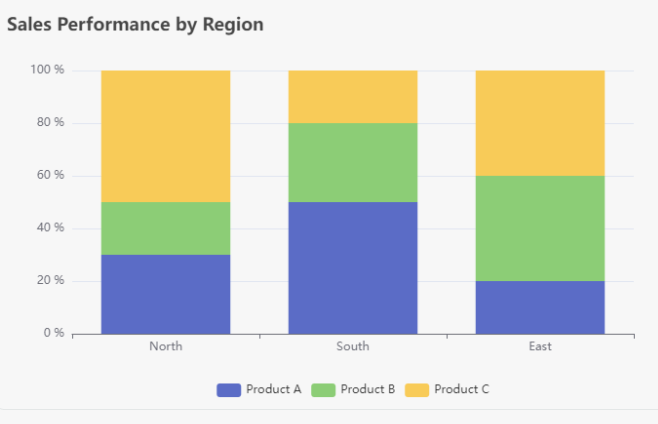
Let’s consider a company that tracks sales performance across three regions (North, South, East) for three product categories (A, B, C) over a year. The sales data (in thousands) is as follows:
| Region | Product A | Product B | Product C |
|---|---|---|---|
| North | 30 | 20 | 50 |
| South | 50 | 30 | 20 |
| East | 20 | 40 | 40 |
Step 1: Data Preparation
Convert the absolute sales figures into percentages for each region:
- North:
- A: 30100=30/100
- B: 20100=20%/100
- C: 50100=50%/100
- South:
- A: 50100=50%/100
- B: 30100=30%/100
- C: 20100=20%/100
- East:
- A: 20100=20%/100
- B: 40100=40%/100
- C: 40100=40%/100
Create 100% Stacked Column Charts with Visual Paradigm Online
- Title: The title of the chart.
- Tooltip: Tooltips that display when hovering over sections.
- Legend: Labels for each product category.
- Axes: The x-axis shows regions, and the y-axis shows percentages (up to 100%).
- Series: Each product category is represented as a stacked bar.
Ultimate Chart-Making Solution
In an era dominated by data, the ability to visualize information effectively is paramount. Whether for business presentations, academic reports, or creative projects, having the right tools to create stunning charts can make all the difference. That’s where Visual Paradigm Online comes in—your ultimate solution for all kinds of chart-making needs.
Why Visual Paradigm Online is the Best Choice for Chart Creation
1. Diverse Chart Types
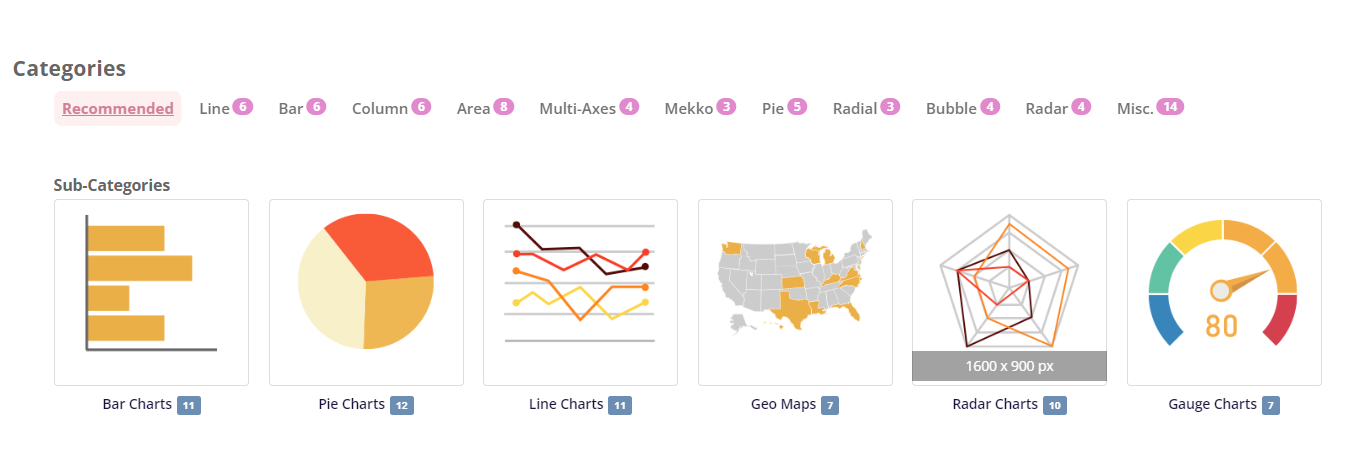
Visual Paradigm Online offers over 50 chart types, ensuring you can find the perfect way to represent your data. Whether you need classic bar and line charts or more specialized formats like area, pie, doughnut, radar, or rose charts, our tool has you covered. This extensive selection allows you to choose the most effective visualization for your specific requirements.
2. Stunning Chart Templates
Creating visually appealing charts has never been easier. With a wide array of beautifully designed templates, Visual Paradigm Online helps you produce professional-quality infographics, posters, presentations, and reports. Just replace the placeholder text and data, and you’ll have a polished product ready for sharing in minutes.
3. Complete Customization
Every project is unique, and Visual Paradigm Online understands that. Our chart maker allows you to customize every aspect of your charts, from colors and fonts to the positioning of titles and legends. This flexibility ensures that your charts not only convey information effectively but also align perfectly with your brand identity.
4. Quick and Efficient Chart Creation
Time is crucial in today’s fast-paced environment, and our tool enables you to transform raw data into impressive visuals in just minutes. The intuitive interface simplifies data entry and immediate visualization, allowing you to meet tight deadlines without compromising quality.
5. No Financial Commitment Required
Getting started with Visual Paradigm Online is completely hassle-free! You can explore the full range of our chart-making capabilities without needing to provide a credit card. This allows you to experience the benefits of our tool firsthand without any financial pressure.
Conclusion
When it comes to creating charts, Visual Paradigm Online stands out as the ultimate solution. With a vast selection of chart types, stunning templates, and extensive customization options, you can create professional-grade charts that elevate your presentations and reports.
Start Your Journey Today!
Ready to revolutionize your data visualization? Explore all templates and discover why Visual Paradigm Online is the go-to choice for all your chart-making needs. Whether you’re preparing for a crucial meeting, crafting an insightful report, or designing an eye-catching infographic, our tool is here to help you communicate your message effectively and beautifully.
100% Stacked Column Charts Templates

