What is Force Field Analysis?
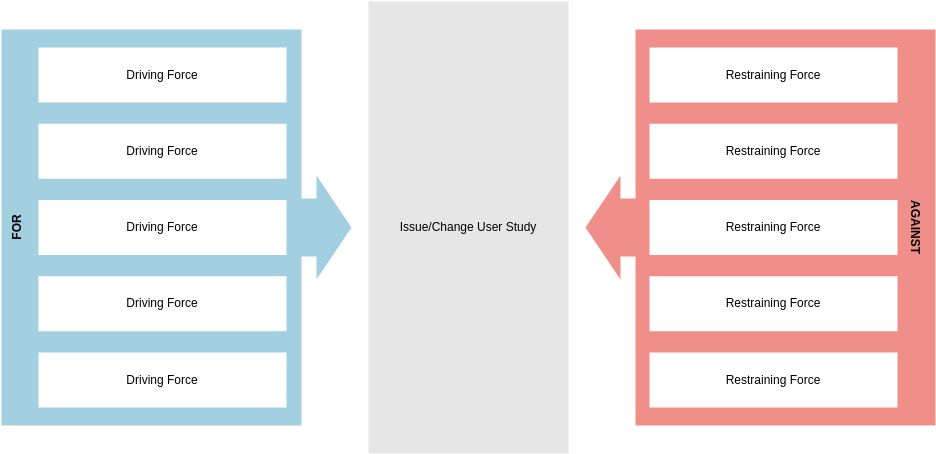
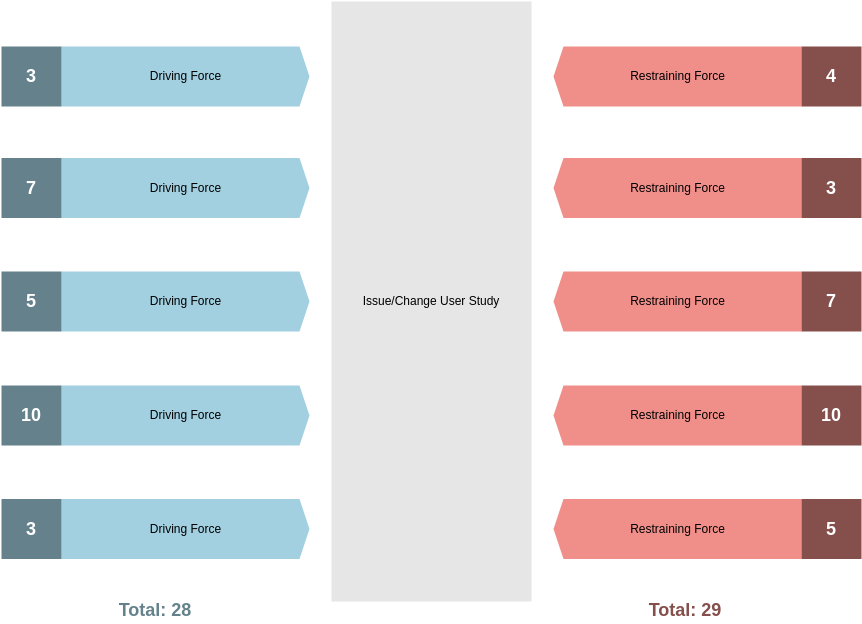
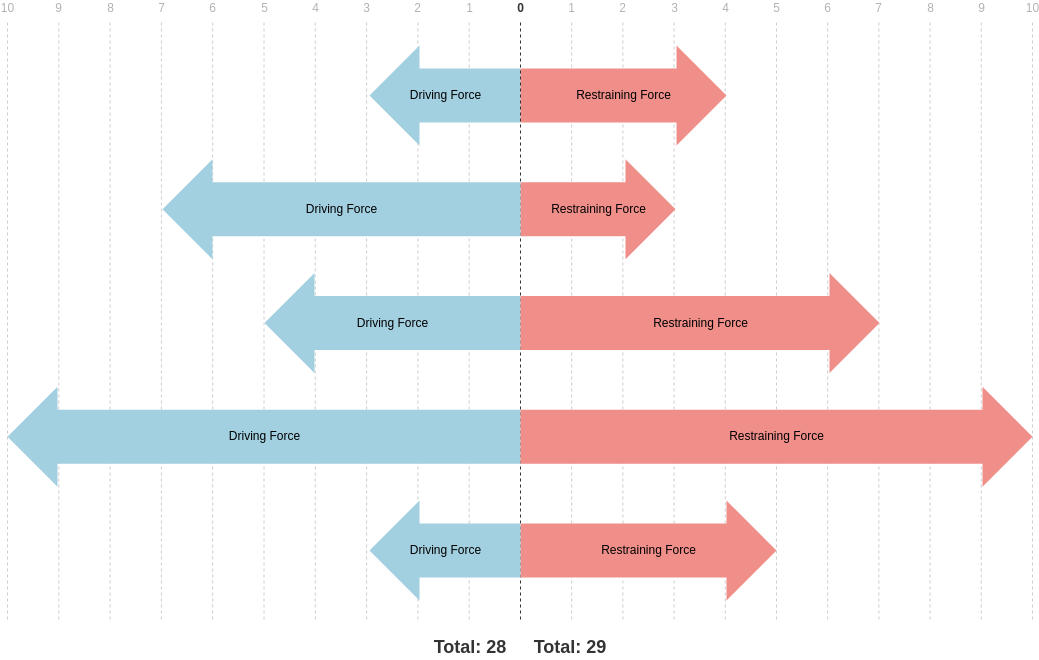
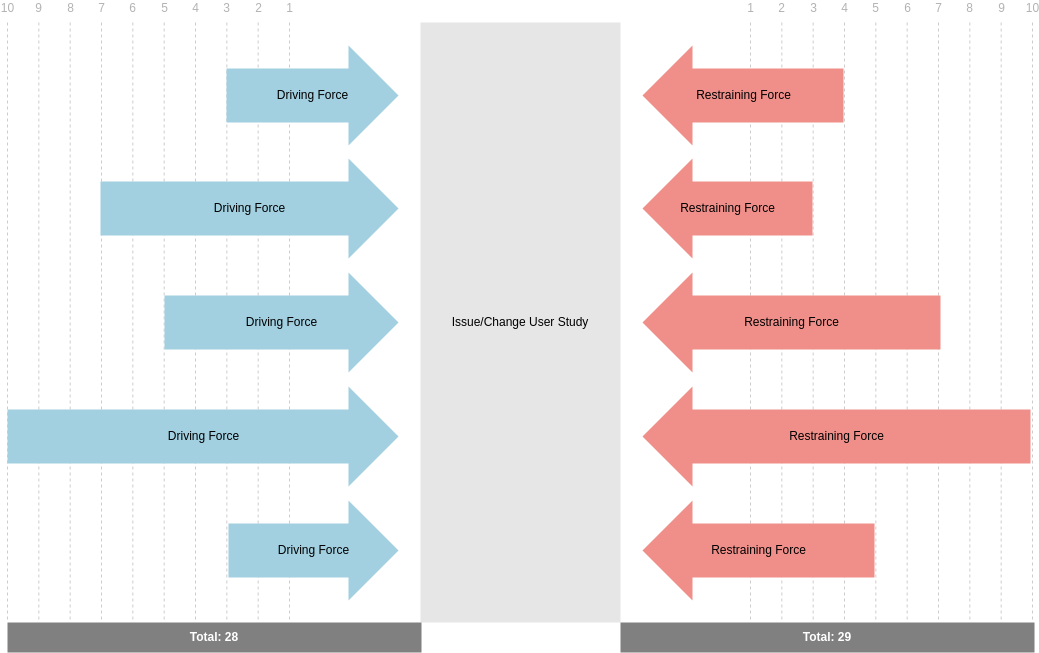
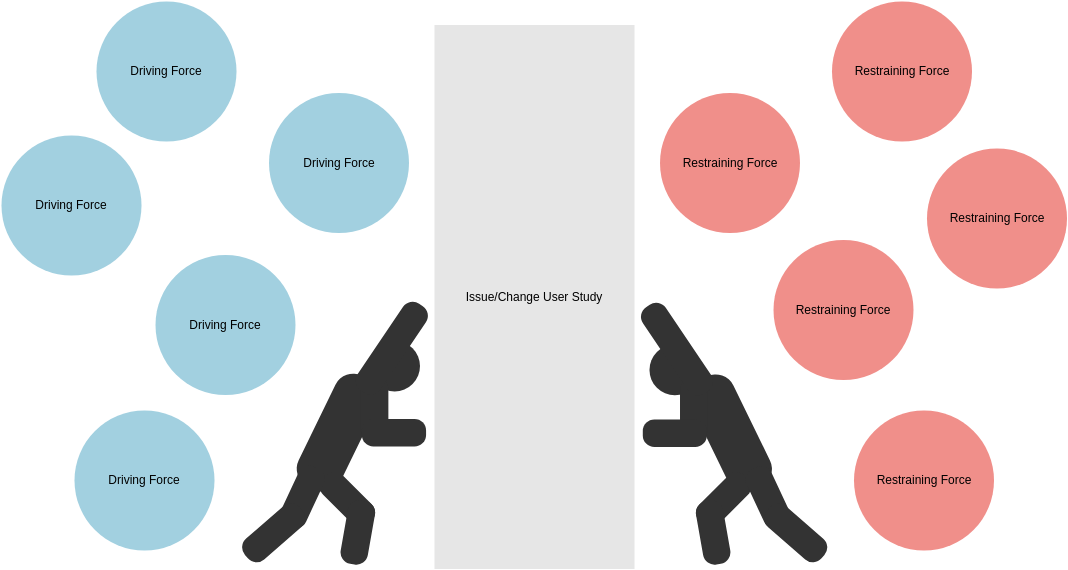
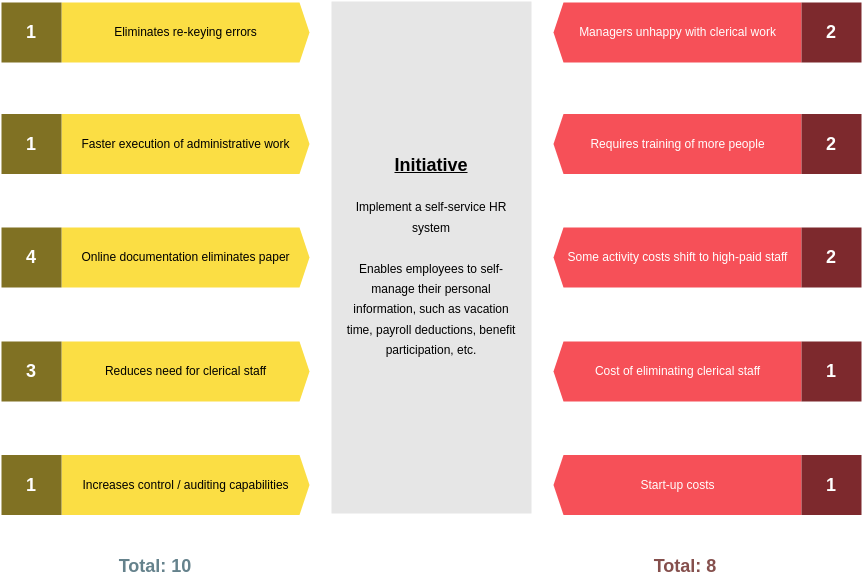
Force Field Analysis is a strategic tool used to identify and evaluate the forces that impact a decision or change initiative. Developed by Kurt Lewin, it helps visualize the balance between driving forces (which promote change) and restraining forces (which hinder change). This analysis is particularly useful in organizational change management.
Using the Attached Image
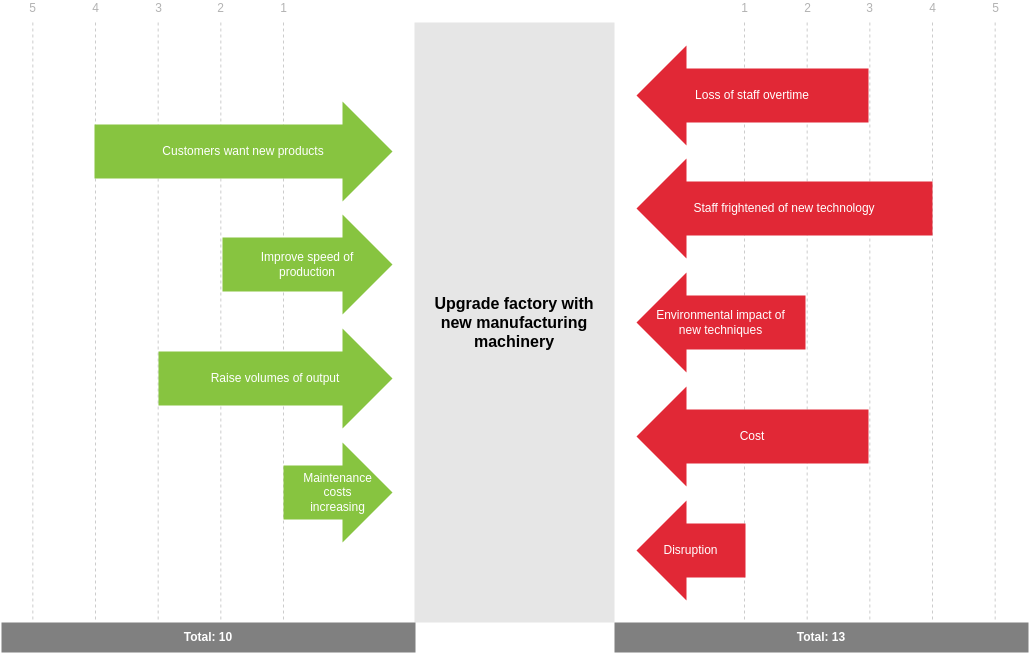
The image you provided outlines various driving and restraining forces, along with their assigned scores. Here’s a breakdown of the concepts:
Driving Forces (Left Side)
These are the factors that support or encourage the change:
- Driving Forces with Scores:
- Customers want new products (Score: 3)
- Improve speed of production (Score: 2)
- Raise volumes of output (Score: 2)
- Maintenance costs increasing (Score: 1)
Restraining Forces (Right Side)
These are the factors that resist or oppose the change:
- Restraining Forces with Scores:
- Loss of staff overtime (Score: 3)
- Staff frightened of new technology (Score: 2)
- Environmental impact of new technologies (Score: 2)
- Cost (Score: 2)
- Disruption (Score: 1)
How to Determine the Scores
- Identify Forces: List all driving and restraining forces relevant to the change initiative.
- Assign Scores: Rate each force on a scale (commonly 1 to 5) based on its strength or influence:
- 1: Weak influence
- 5: Strong influence
- Sum Scores: Calculate the total scores for both driving and restraining forces.
How to Interpret Each Score
- Driving Forces:
- Higher scores indicate stronger support for the change, meaning more compelling reasons to proceed.
- Restraining Forces:
- Higher scores suggest significant challenges or obstacles that need to be addressed before moving forward.
Interpreting the Total Score
- Calculate Total Scores:
- Total Driving Score (TDS): Add up all driving force scores.
- Total Restraining Score (TRS): Add up all restraining force scores.
- Net Score Calculation:
Net Score=Total Driving Score−Total Restraining Score\text{Net Score} = \text{Total Driving Score} – \text{Total Restraining Score}
Example Calculation from the Image
- Total Driving Score: 3 + 2 + 2 + 1 = 8
- Total Restraining Score: 3 + 2 + 2 + 2 + 1 = 10
- Net Score: 8 – 10 = -2 (indicating stronger restraining forces)
Interpretation of the Total Score
- Positive Net Score: Indicates a favorable environment for change. Action: Move forward.
- Negative Net Score: Indicates significant challenges. Action: Address restraining forces before proceeding.
- Zero Net Score: Indicates balance. Action: Strengthen driving forces or reduce restraining forces.
How to Use Force Field Analysis
- Visualize: Create a diagram similar to the one provided, clearly labeling driving and restraining forces with their scores.
- Analyze: Review the scores to understand the dynamics at play.
- Develop Action Plans:
- Enhance Driving Forces: Focus on boosting factors that support the change.
- Mitigate Restraining Forces: Create strategies to address obstacles, such as training for staff or financial planning to manage costs.
- Monitor and Reassess: After implementing changes, regularly revisit the analysis to adjust strategies based on evolving circumstances.
Why Choose Visual Paradigm Online for Diagramming?
Visual Paradigm Online is a powerful cloud-based diagramming tool that offers a range of features ideal for individuals and teams looking to create professional diagrams efficiently. Here are some compelling reasons to consider it:
1. User-Friendly Interface
- Intuitive drag-and-drop functionality makes it easy for users of all skill levels to create diagrams.
2. Wide Range of Diagram Types
- Supports various diagram types, including flowcharts, UML diagrams, ER diagrams, mind maps, and more, catering to diverse needs.
3. Collaboration Features
- Real-time collaboration allows multiple users to work on a diagram simultaneously, enhancing teamwork and communication.
4. Cloud-Based Convenience
- Access your diagrams from anywhere with an internet connection, ensuring flexibility and ease of use.
5. Templates and Examples
- A rich library of templates and examples helps users get started quickly and inspires creativity.
6. Integration Capabilities
- Easily integrates with other tools and platforms, enhancing workflow efficiency.
7. Export Options
- Export diagrams in various formats (PNG, PDF, SVG, etc.) for easy sharing and presentation.
8. Version Control
- Keeps track of changes, allowing users to revert to previous versions if needed.
Visual Paradigm Online stands out as an ultimate diagramming tool for both individual users and teams. Its robust features, ease of use, and collaborative capabilities make it an excellent choice for anyone looking to create high-quality diagrams efficiently. Whether you’re in project management, software development, or education, Visual Paradigm can help streamline your diagramming needs.
Summary
Force Field Analysis is a valuable tool for assessing the feasibility of change initiatives. By identifying and scoring driving and restraining forces, organizations can make informed decisions and develop effective strategies to facilitate successful change.
Force Field Analysis Template (With Score)
