Doughnut Charts Tutorial

Doughnut Charts Tutorial

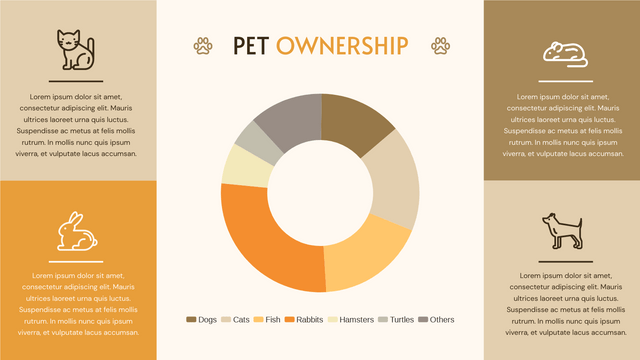
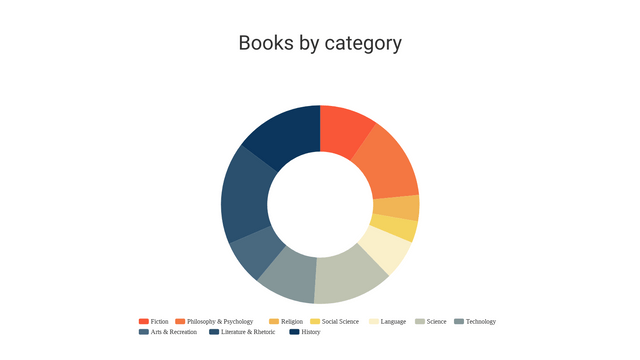
Doughnut charts are a variation of pie charts that display data in a circular format, with a hole in the center. They are often used to show the proportions of various components of a whole, making them useful for visualizing relative sizes.
Key Concepts

  1. Structure: A doughnut chart is composed of arcs that represent different categories of data. Each arc’s angle is proportional to the value it represents.
  2. Data Representation: The total value of all categories should sum to a meaningful total (e.g., 100% for percentages). The hole in the center can also be used to display additional information, such as the total value or a label.
  3. Colors and Legends: Different segments are typically colored differently to allow easy differentiation. A legend can help clarify what each color represents.
  4. Interactivity: Modern implementations can include tooltips that provide more information when users hover over segments.

Realistic Example

Scenario: Market Share of Smartphone Brands

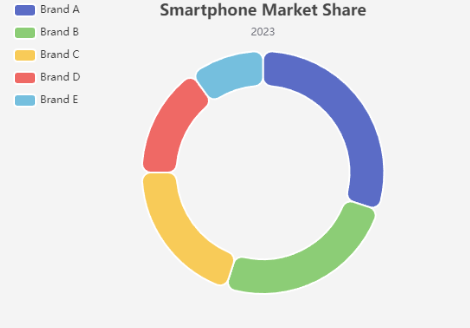
Let’s say we have market share data for five smartphone brands:

  • Brand A: 30%
  • Brand B: 25%
  • Brand C: 20%
  • Brand D: 15%
  • Brand E: 10%

Data Representation

This data can be visually represented using a doughnut chart, which will help viewers quickly grasp the market distribution among these brands.
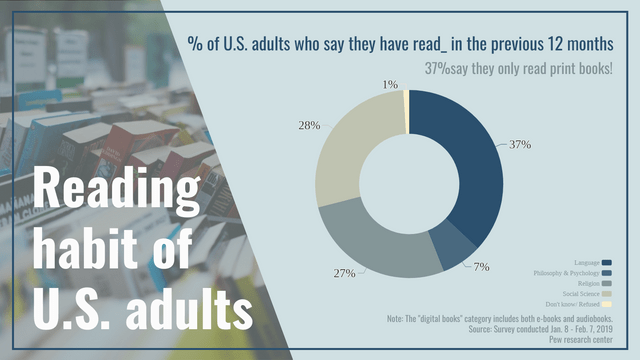
Creating a Doughnut Chart with Visual Paradigm Online

Pie Chart vs. Doughnut Chart

Both pie charts and doughnut charts are popular visualization tools for representing data proportions. While they share similarities, they also have distinct characteristics that may make one more suitable than the other depending on the context. Here’s a comparison of the two:

Key Differences

1. Structure

  • Pie Chart:
    • A complete circle divided into slices.
    • Each slice represents a proportion of the whole.
  • Doughnut Chart:
    • A circular chart with a hole in the center.
    • Similar to a pie chart but allows for an empty space in the middle.

2. Data Representation

  • Pie Chart:
    • Useful for showing parts of a whole when the total is meaningful, typically 100%.
    • Limited in the number of slices; too many can make it hard to read.
  • Doughnut Chart:
    • Retains the same proportional data representation but provides more flexibility.
    • The central hole can be used to display additional information (e.g., total value or labels).

3. Readability

  • Pie Chart:
    • Can become cluttered with too many categories or similar-sized slices.
    • Harder to compare slices directly unless the differences are significant.
  • Doughnut Chart:
    • The center hole can enhance readability by focusing attention on the segments.
    • Often easier to compare multiple categories due to the lack of clutter in the center.

4. Aesthetic and Customization

  • Pie Chart:
    • Generally simpler and more traditional.
    • Limited in terms of customization options due to its solid form.
  • Doughnut Chart:
    • Offers more aesthetic flexibility, allowing for design elements in the center.
    • Can incorporate legends or labels within the center, enhancing visual appeal.

5. Use Cases

  • Pie Chart:
    • Best for displaying a small number of categories.
    • Commonly used in reports or presentations where simplicity is key.
  • Doughnut Chart:
    • Suitable for visualizing larger datasets or when emphasizing certain values.
    • Often used in dashboards, allowing for additional context in the center.

Summary

Feature Pie Chart Doughnut Chart
Structure Complete circle Circle with a central hole
Data Representation Parts of a whole Parts of a whole with flexibility
Readability Can be cluttered Generally clearer with a focus
Aesthetic Simple and traditional More customizable and flexible
Use Cases Small datasets Larger datasets or dashboards

Conclusion

Doughnut charts are an effective way to visualize proportional data, making it easy to compare parts of a whole. Using libraries like Visual Paradigm Online Chart tool simplifies the process of creating interactive and visually appealing charts. You can easily adapt the example provided to fit different datasets or styles as needed.

Both pie charts and doughnut charts have their place in data visualization. The choice between the two depends on the specific needs of the presentation, the complexity of the data, and the desired aesthetic. Understanding their differences will help you select the most effective chart for your data storytelling.

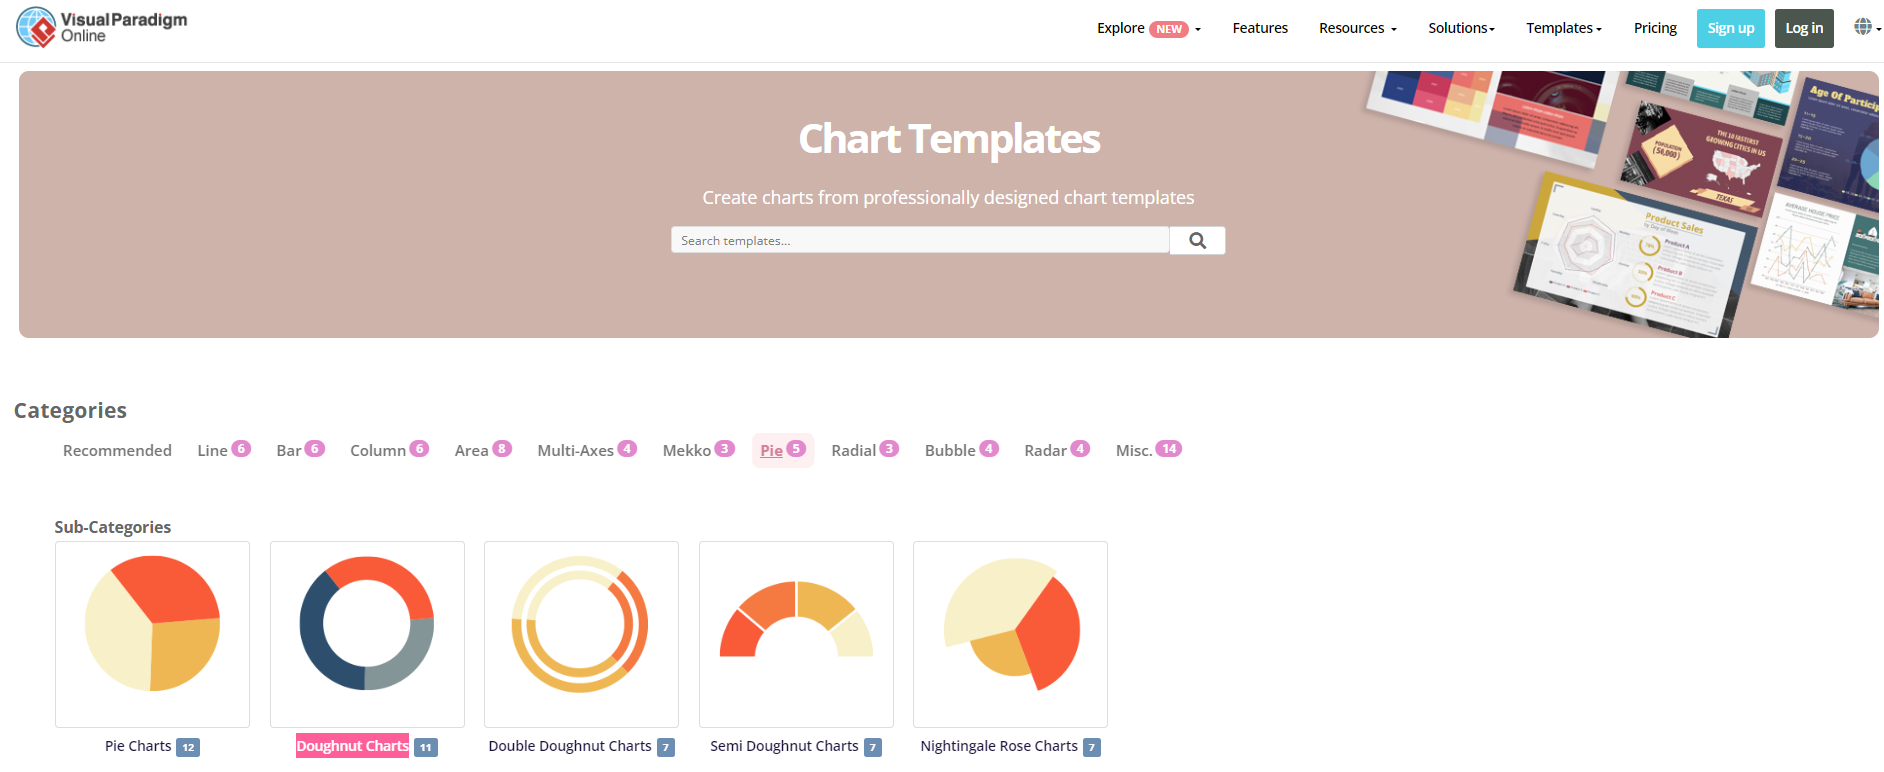
Doughnut Charts Templates

Visual Paradigm Online: Your Ultimate Solution for Visuals

Visual Paradigm Online is a comprehensive tool designed for creating a wide array of visual representations, including charts, diagrams, infographics, collages, and more. Here’s why it stands out as an ultimate solution for your visual needs:

Key Features

1. Diverse Chart Options

  • Variety of Charts: Create pie charts, doughnut charts, bar charts, line graphs, and more.
  • Customizable Templates: Start with pre-designed templates to save time and ensure professional results.

2. Diagramming Tools

  • Flowcharts & UML Diagrams: Easily design flowcharts, UML diagrams, and other technical diagrams.
  • Mind Maps: Organize ideas visually with intuitive mind mapping tools.

3. Infographic Creation

  • User-Friendly Interface: Drag-and-drop functionality makes it easy to create engaging infographics.
  • Rich Resource Library: Access icons, images, and shapes to enhance your designs.

4. Collages and Visuals

  • Photo Editing: Combine and edit images to create stunning collages.
  • Layouts and Design: Use various layouts to present your visuals in an appealing manner.

5. Collaboration Features

  • Real-Time Collaboration: Work with team members simultaneously on projects, enhancing productivity.
  • Feedback Tools: Easily share your visuals for feedback and incorporate changes quickly.

6. Cloud-Based Accessibility

  • Access Anywhere: Being cloud-based means you can work from anywhere, on any device.
  • Automatic Saving: No worries about losing your work; everything is saved automatically.

7. Export Options

  • Multiple Formats: Export your visuals in various formats (PNG, JPEG, PDF, etc.) for easy sharing.
  • Integration: Seamlessly integrate with other tools and platforms.

Use Cases

  • Business Presentations: Create compelling visuals for reports, proposals, and presentations.
  • Education: Design educational materials, diagrams, and infographics to enhance learning.
  • Marketing: Develop eye-catching infographics and collages for social media and campaigns.

Visual Paradigm Online is an all-in-one solution for anyone looking to create visually engaging materials. With its diverse features, user-friendly interface, and collaborative capabilities, it caters to professionals, educators, and marketers alike. Whether you need to create detailed diagrams or striking infographics, Visual Paradigm Online provides the tools necessary to bring your ideas to life.