Category: Fishbone Analysis
Case Study: Addressing Project Challenges Through Cause and Effect Analysis

Problem Scenario:
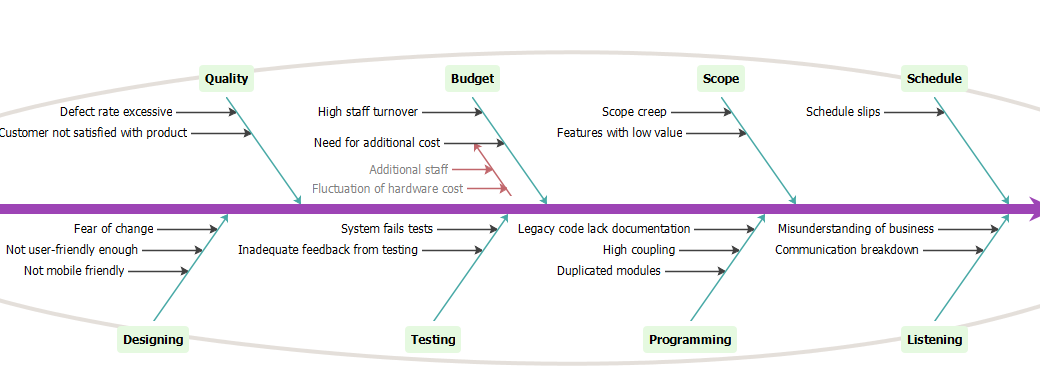
A software development company is facing several challenges in the execution of a critical project. The project has experienced issues related to quality, budget, scope, schedule, and communication, leading to overall project risks and potential project failure.

Cause
…Applying Fishbone Analysis to Address Software Project Challenges

Fishbone Analysis, also known as the Ishikawa Diagram or Cause-and-Effect Diagram, is a widely-used problem-solving tool that helps identify the potential causes of a specific problem or effect.
The key features of Fishbone Analysis are:
- Graphical Representation:
The analysis is
Fishbone Analysis: A Powerful Tool for Root Cause Identification

Introduction
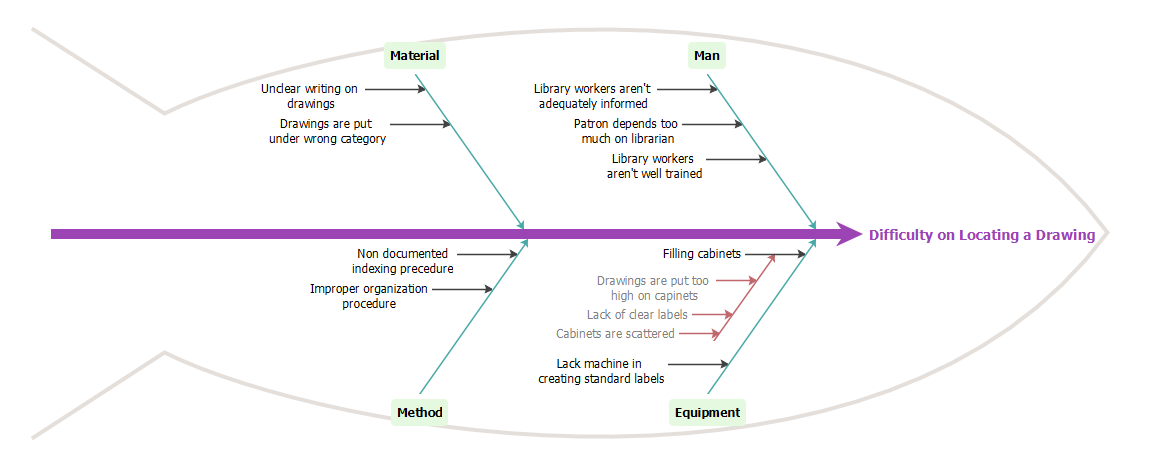
Fishbone Analysis, also known as the Ishikawa Diagram or cause-and-effect diagram, is a graphical representation used to identify and analyze the potential causes of a problem or issue. This technique resembles the skeleton of a fish, with the problem