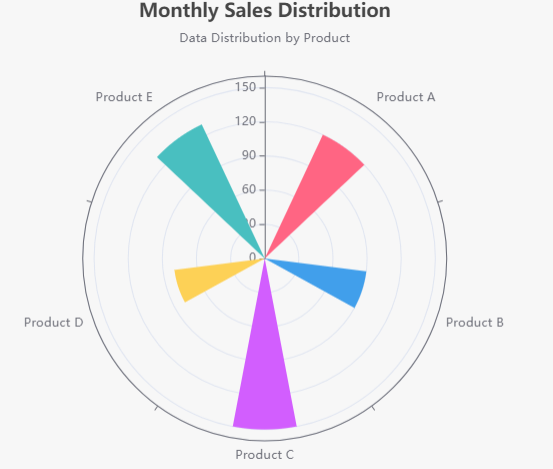
What is a Rose Chart?
A Rose Chart (or Polar Area Chart) is a circular graph that displays data in a way that emphasizes the magnitude of values associated with different categories. The length of each segment represents the value of each category, while the angle is fixed for all categories, creating a visually appealing representation of data.
When to Use a Rose Chart
Rose Charts are particularly useful when you want to:
- Compare different categories of data across a common measure.
- Visualize data with cyclical patterns, such as time-based data (e.g., seasons, months).
- Highlight the magnitude of each category in relation to the others.
Creating a Rose Chart with Visual Paradigm Online
Example Use Case
Example Data: Monthly Sales Distribution
Suppose you have the following monthly sales data for five products:
| Product | Sales |
|---|---|
| A | 120 |
| B | 90 |
| C | 150 |
| D | 80 |
| E | 130 |
You can visualize this data using the Rose Chart setup provided above. Just replace the sales data in the series array with [120, 90, 150, 80, 130] to see the distribution of monthly sales across products.

Unlock Your Creativity with Visual Paradigm Online!
Are you looking for the best solution to create stunning charts, diagrams, visuals, and infographics? Look no further than Visual Paradigm Online!
Why Choose Visual Paradigm Online?
🌟 User-Friendly Interface: Whether you’re a beginner or an experienced designer, our intuitive platform makes it easy to create professional-quality visuals in minutes.
📊 Diverse Chart Options: From bar charts to pie charts, and everything in between, Visual Paradigm Online offers a wide range of chart types to suit your data visualization needs.
🖼️ Customizable Diagrams: Create flowcharts, UML diagrams, and more with customizable templates designed to fit your specific requirements.
🎨 Stunning Infographics: Transform complex information into engaging infographics that capture attention and convey your message effectively.
🌐 Collaborative Features: Work with your team in real-time, share your designs, and gather feedback seamlessly, no matter where you are.
🚀 Cloud-Based Convenience: Access your projects anytime, anywhere! All you need is an internet connection to get started.
Special Offer!
Join thousands of satisfied users and elevate your presentations and projects with Visual Paradigm Online. Sign up today and enjoy a free trial to experience the power of our tools firsthand!
👉 Start Creating Now! Visual Paradigm Online
Transform your ideas into visuals that inspire and inform. With Visual Paradigm Online, you’re just a click away from bringing your concepts to life!