Bar charts are a great way to compare quantities across different categories. In this guide, we will create a bar chart using Visual Paradigm Online Charting tool, visualize some realistic sales data, and interpret the results.
Step 1: Choose Your Data
For this example, let’s analyze the quarterly sales figures for three different products (Product A, Product B, and Product C) over the last year.
Data
- Quarters: Q1, Q2, Q3, Q4
- Sales for Product A: 150, 200, 250, 300
- Sales for Product B: 180, 220, 200, 260
- Sales for Product C: 130, 190, 240, 280
Step 2: Visualize with Visual Paradigm Online Charting Tool
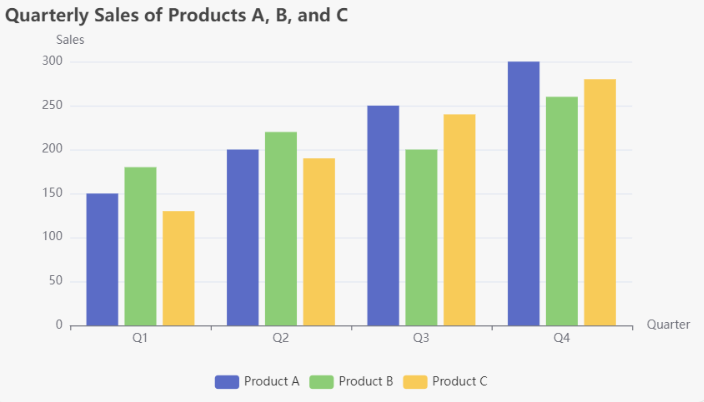
Step 3: Interpretation of the Chart
Analyzing the Data
- Product A:
- Sales increased steadily from Q1 to Q4, starting at 150 and reaching 300. This indicates strong growth and market acceptance.
- Product B:
- Product B’s sales show an initial increase from Q1 to Q2, but then a slight decline in Q3 before rising again in Q4. This fluctuation might suggest seasonal trends or varying consumer preferences.
- Product C:
- Sales for Product C also show a general upward trend. Starting at 130 in Q1, sales climb to 280 by Q4, reflecting a positive reception and possibly effective marketing strategies.
Comparative Insights
- By comparing the sales figures, we see that Product A consistently outperformed the other two products in every quarter.
- Product B had the highest sales in Q2, while Product C had a slower growth rate but still ended strong.
- Understanding these trends can help in strategic planning, inventory management, and marketing focus for the upcoming quarters.
Elevate Your Data Visualization with Visual Paradigm Online
Looking to enhance your data visualization capabilities? Visual Paradigm Online is your go-to solution for creating stunning charts, infographics, and a wide array of visuals that can transform your data into compelling stories!
Why Choose Visual Paradigm Online?
- Versatile Charting Tools: Easily create bar charts, line charts, pie charts, and more with just a few clicks. Whether you’re analyzing sales data or showcasing survey results, Visual Paradigm has you covered.
- Infographic Creator: Design eye-catching infographics that effectively communicate your message. With customizable templates and design elements, you can make your visuals stand out.
- User-Friendly Interface: No design experience? No problem! Visual Paradigm Online offers an intuitive platform that simplifies the creation of professional-quality visuals.
- Collaboration Features: Work seamlessly with your team in real-time. Share your designs and gather feedback instantly, ensuring everyone is on the same page.
- Cloud-Based Access: Work on your projects from anywhere, on any device. Your designs are always accessible and secure in the cloud.
Ideal for All Users
Whether you’re a business analyst, a marketer, an educator, or a student, Visual Paradigm Online equips you with the tools to create impactful visuals that capture attention and drive engagement.
Try It Today!
Don’t miss out on the opportunity to elevate your presentations and reports. Visit Visual Paradigm Online to start your free trial and unlock the potential of your data through beautiful visuals. Transform information into insight with Visual Paradigm Online!


