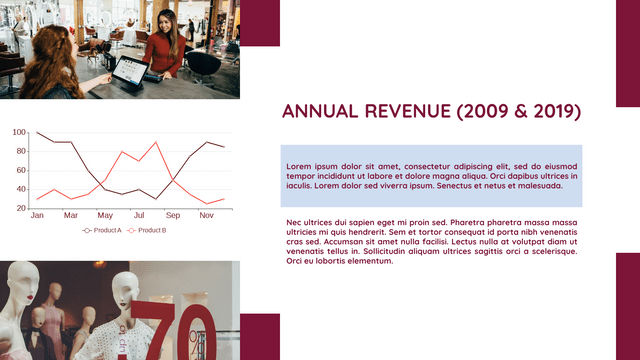
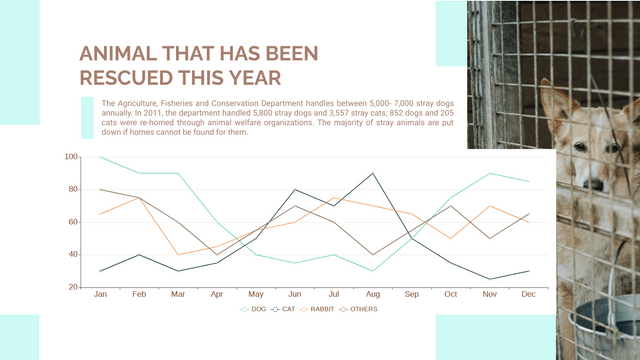
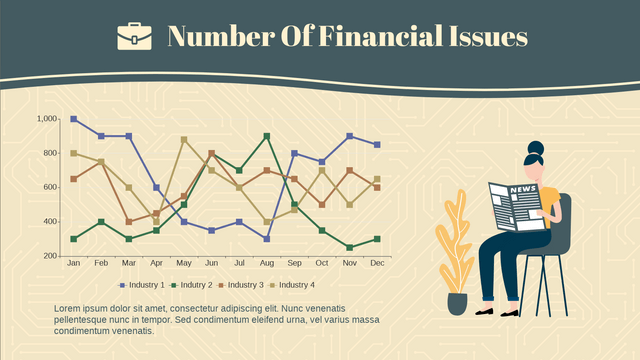
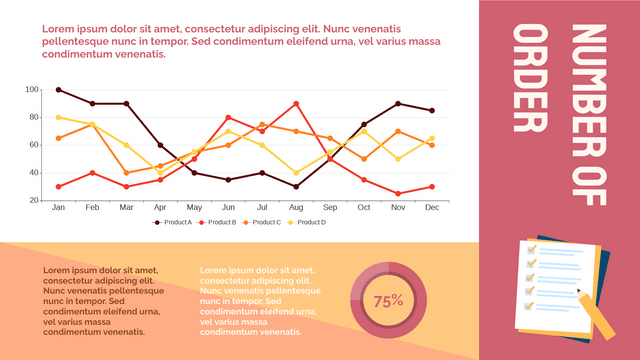
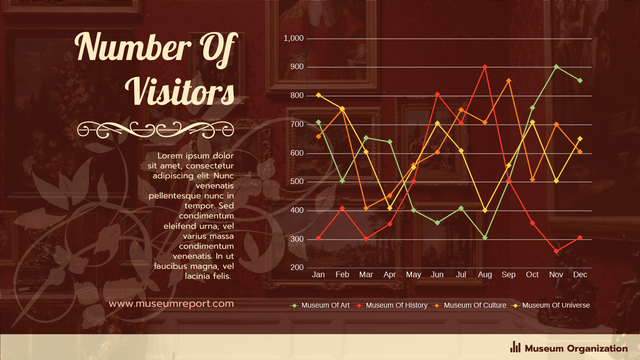
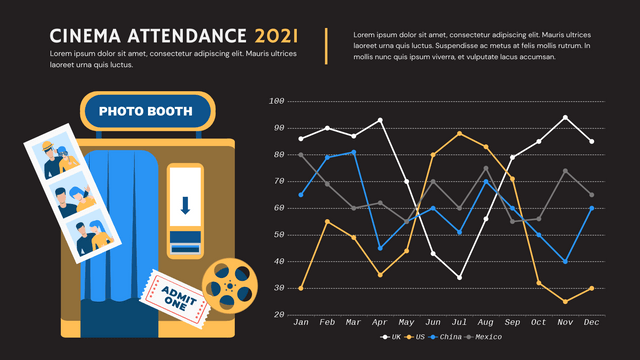
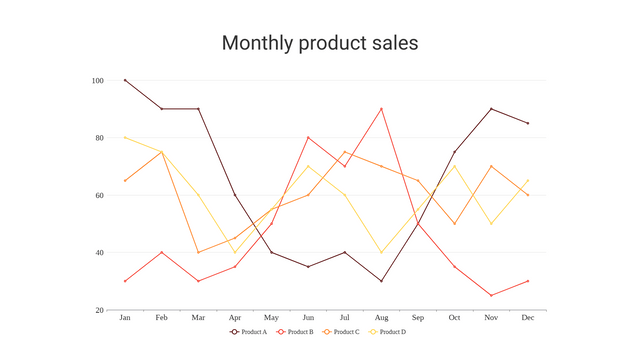
Line charts are a powerful way to visualize data trends over time. They consist of points connected by straight lines, making it easy to see changes in data at a glance. In this tutorial, we’ll explore key concepts related to line charts and provide an example using ECharts, a popular data visualization library.
Key Concepts
1. Data Points
- A line chart is made up of data points, each representing a value at a specific time or category. The X-axis typically represents time or categories, while the Y-axis represents the values of the data.
2. Axes
- X-Axis: Represents the independent variable (usually time).
- Y-Axis: Represents the dependent variable (the value being measured).
3. Trend Lines
- The lines connecting the data points illustrate the trend. This could be upward, downward, or stable, providing insights into the behavior of the data over time.
4. Multiple Lines
- A line chart can display multiple lines, each representing different datasets. This allows for easy comparison between multiple variables.
5. Legends and Labels
- Legends help identify which line corresponds to which dataset, while labels on axes provide context for the values being represented.
Example
Scenario
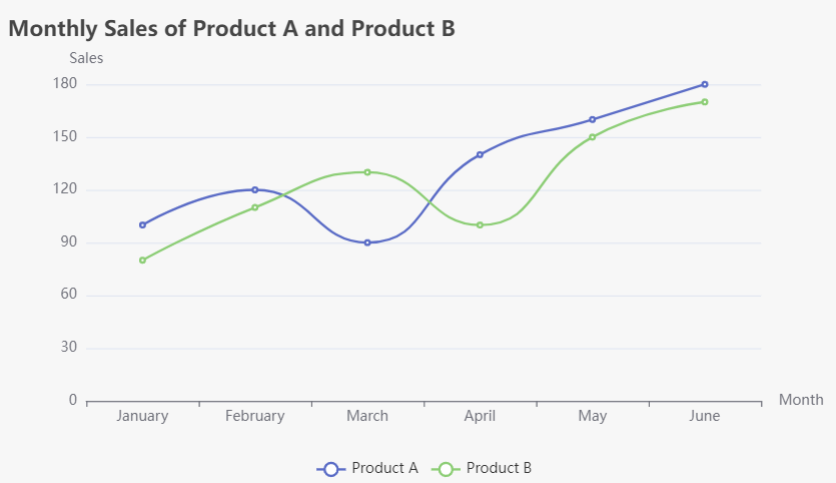
Let’s visualize the monthly sales figures of a company over the first six months of the year for two different products: Product A and Product B.
Data
- Months: January, February, March, April, May, June
- Sales for Product A: 100, 120, 90, 140, 160, 180
- Sales for Product B: 80, 110, 130, 100, 150, 170
Conclusion
Line charts are an effective way to visualize trends over time, making them useful for various applications in business, science, and beyond. Using our Chart tool, you can create interactive and responsive visualizations that help convey complex data in an accessible format.
Enhance Your Data Visualization with Visual Paradigm Online
Are you looking to take your data visualization skills to the next level? Look no further than Visual Paradigm Online! This powerful tool not only allows you to create stunning line charts and other visualizations, but it also offers an intuitive interface that makes the process seamless.
Key Features of Visual Paradigm Online:
- User-Friendly Interface: Create professional charts and diagrams without any design experience.
- Rich Chart Library: Access a wide variety of chart types, including line charts, bar charts, pie charts, and more to suit your data needs.
- Collaboration Tools: Work with your team in real-time, making it easy to share ideas and gather feedback.
- Templates and Examples: Choose from a collection of pre-designed templates to jumpstart your projects.
- Cloud-Based: Access your work from anywhere, on any device, ensuring you can collaborate and present your data seamlessly.
Why Choose Visual Paradigm Online?
Whether you’re a business analyst, a marketer, or a student, Visual Paradigm Online equips you with the tools to turn complex data into clear, engaging visuals. With its versatile features, you can create impactful presentations and reports that captivate your audience.
Get Started Today!
Don’t miss out on the opportunity to enhance your data visualization capabilities. Visit Visual Paradigm Online to start your free trial and discover how easy it is to create stunning charts and diagrams. Transform your data into stories that resonate!


