Visualize Your Data withGo-Chart Chart Maker
With our powerful charting tools, seamlessly integrated with Visual Paradigm Online, you can bring your data to life, making it easier to analyze, understand, and present.
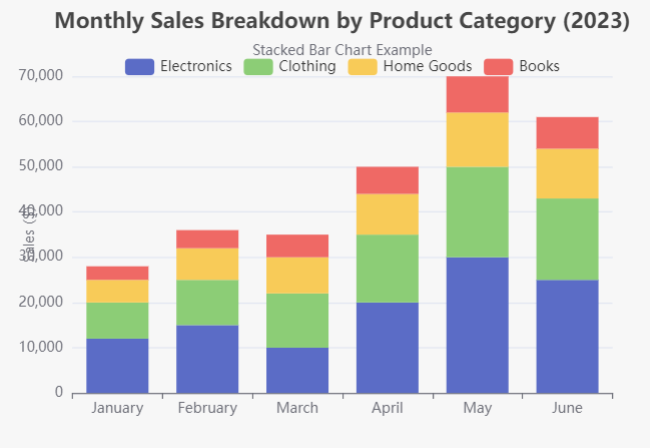
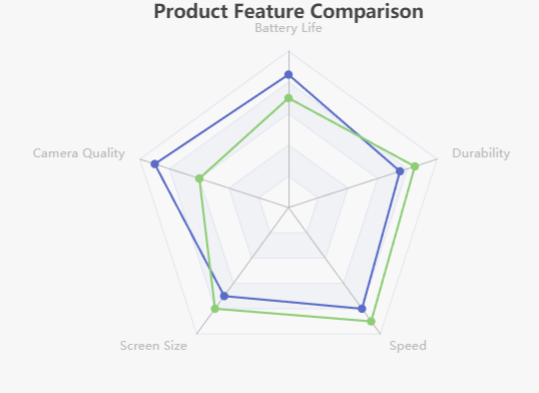
Go-Chart and Visual Paradigm Online: The Perfect Pair for Chart Creation

Intuitive Chart Editing Made Easy
Chart Creation with Intuitive Editing
Go-Chart.com provides an intuitive chart maker that allows you to easily create and customize charts with minimal effort. Whether you’re adjusting data, selecting styles, or refining layouts, this user-friendly chart tool ensures a smooth and efficient experience. Focus on visualizing your data and crafting professional charts, all without the need for complicated software.
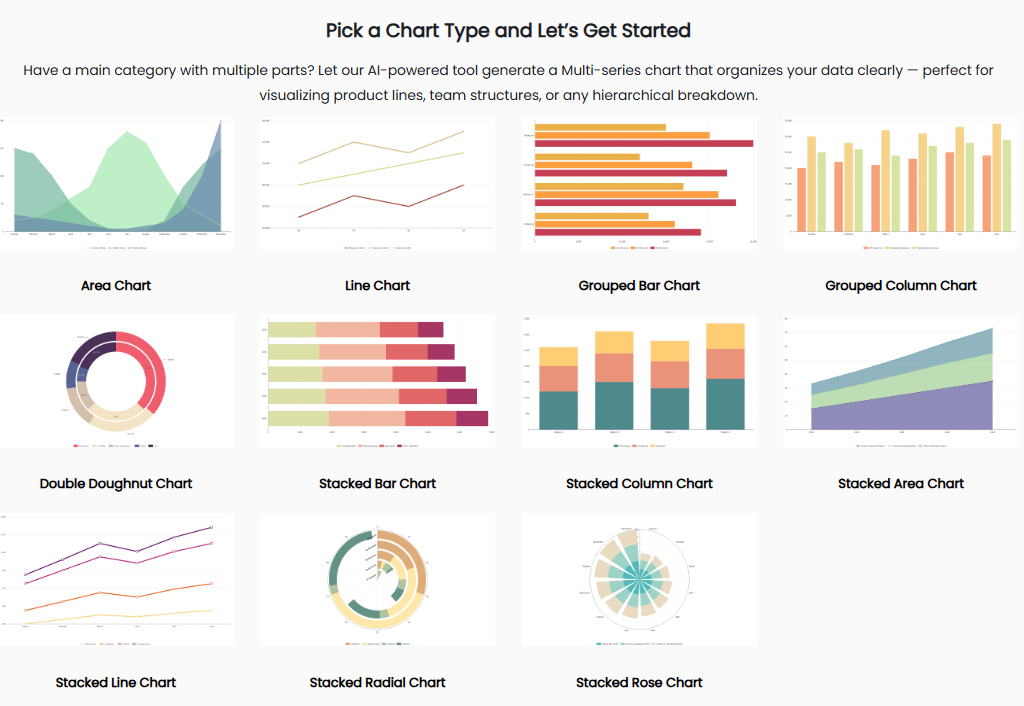
50+ Chart Types
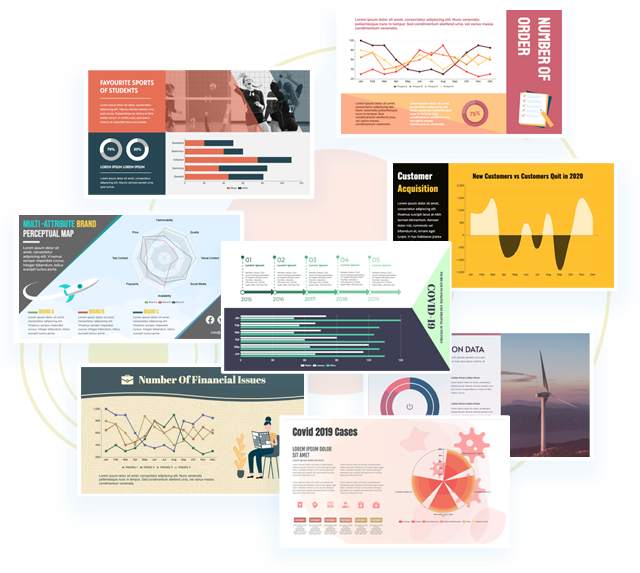
Explore Our Chart Types
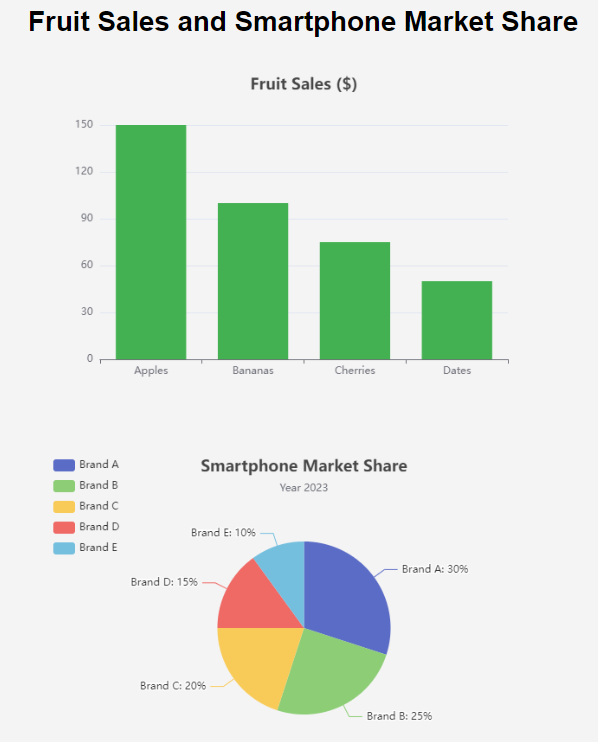
- Bar Charts: Ideal for comparing quantities across different categories.
- Line Charts: Perfect for visualizing trends over time.
- Area Charts: Highlight the magnitude of change over a time period.
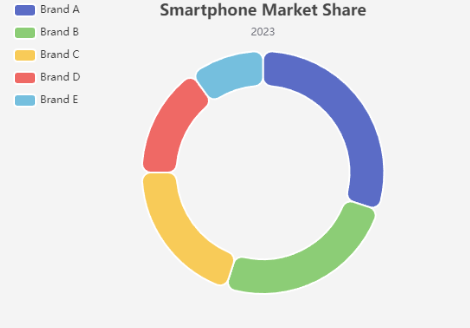
- Pie & Doughnut Charts: Show proportions and relative shares within a dataset.
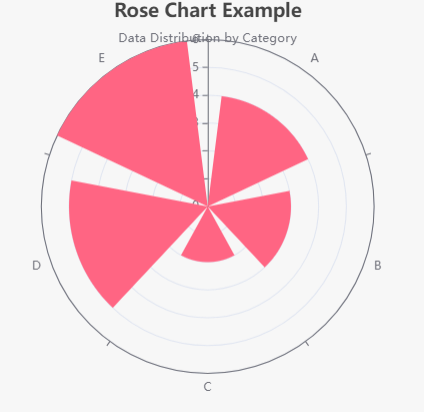
- Radar Charts: Compare multiple variables with a unique, circular design.
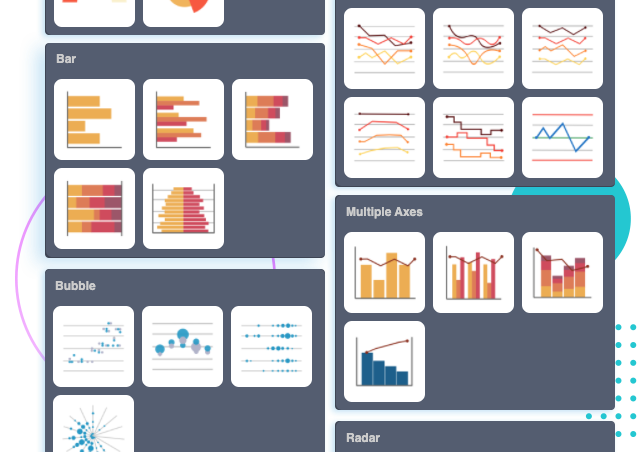
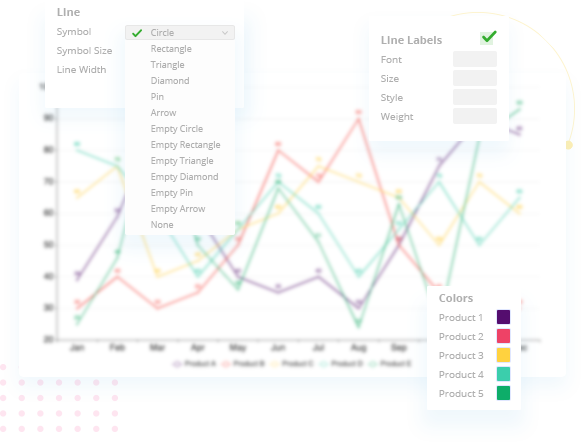
Customize Colors, Styles, and Layouts Easily
Design Charts Your Way
Take your charts to the next level with endless customization options. Go-Chart.com lets you tailor every detail—colors, fonts, styles, and layouts—to suit your needs. Whether it’s for a business presentation or a personal project, create visuals that align perfectly with your vision.
Why Choose Go-Chart.com?
Go-Chart.com offers an intuitive and versatile chart maker, with over 50 customizable chart types to suit any data visualization need. Whether you’re a creator, designer, or business professional, this powerful charting tool empowers you to craft professional, eye-catching charts with ease.
User-Friendly Interface
Effortlessly create and customize charts with just a few clicks.
Customizable Options
Tailor every aspect of your chart, from colors to labels, ensuring it aligns with your brand and presentation style.
Advanced Features
Beyond the basics, dive into advanced charting options like stacked, multi-axis, and interactive charts.
Seamless Integration
Export your charts in multiple formats or directly embed them into your reports, presentations, and websites.
Explore More Templates
Discover Latest Trends in Our Blog Hub
Frequently Asked Questions
No special software is required. Go-Chart.com is a web-based platform, so you can create and edit charts directly in your browser.
